The Query tool - pgAdmin 4 3.0 documentation
The Query tool is a powerful, feature-rich environment that allows you to execute arbitrary SQL commands and review the result set. You can access the Query tool via the Query Tool menu option on the Tools menu, or through the context menu of select nodes of the Browser tree control. The Query Tool allows you to:
- Issue ad-hoc SQL queries.
- Execute arbitrary SQL commands.
- Displays current connection and transaction status as configured by the user.
- Save the data displayed in the output panel to a CSV file.
- Review the execution plan of a SQL statement in either a text or a graphical format.
- View analytical information about a SQL statement.
You can open multiple copies of the Query tool in individual tabs simultaneously. To close a copy of the Query tool, click the X in the upper-right hand corner of the tab bar.
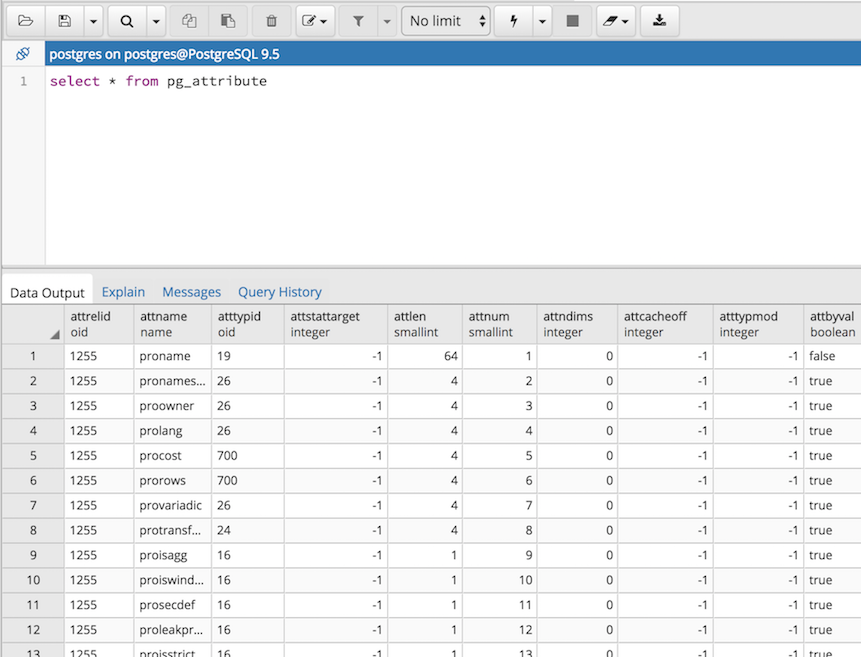
The Query Tool features two panels:
- The upper panel displays the SQL Editor . You can use the panel to enter, edit, or execute a query.
- The lower panel displays the Data Output panel. The tabbed panel displays the result set returned by a query, information about a query’s execution plan, server messages related to the query’s execution, and a history of the queries invoked in the SQL Editor.
The Query Tool Toolbar
The Query Tool toolbar uses context-sensitive icons that provide shortcuts to frequently performed tasks. If an icon is highlighted, the option is enabled; if the icon is grayed-out, the task is disabled. Please note that disabled icons may support functionality accessed via the data editor .

Hover over an icon to display a tooltip that describes the icon’s functionality:
| Icon | Behavior | Shortcut |
|---|---|---|
| Open File | Click the Open File icon to display a previously saved query in the SQL Editor. | |
| Save |
Click the Save icon to perform a quick-save of a previously saved query, or to access the Save menu:
|
|
| Find |
Use the Find menu to search, replace, or navigate the code displayed in the SQL Editor:
|
Cmd+F Cmd+G Cmd+Shift+G Cmd+Shift+F Alt+G |
| Copy | Click the Copy icon to copy the content that is currently highlighted in the Data Output panel. | |
| Edit |
Use options on the Edit menu to access text editing tools; the options operate on the text displayed in the SQL Editor panel:
|
Tab Shift+Tab Cmd+/ Cmd+. Shift+Cmd+/ |
| Execute/Refresh |
Click the Execute/Refresh icon to either execute or refresh the query highlighted in the SQL editor panel. Click the down arrow to access other execution options:
|
F5 F7 Shift+F7 |
| Stop | Click the Stop icon to cancel the execution of the currently running query. | |
| Clear query window |
Use options on the Clear drop-down menu to erase display contents:
the SQL editor panel or the History tab. |
Shift+F7 |
| Download as CSV | Click the Download as CSV icon to download the result set of the current query to a comma-separated list. You can specify the CSV settings through Preferences -> SQL Editor -> CSV output dialogue. | F8 |
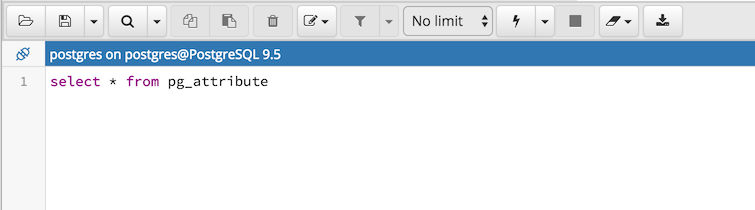
The SQL Editor Panel
The SQL editor panel is a workspace where you can manually provide a query, copy a query from another source, or read a query from a file. The SQL editor features syntax coloring and autocompletion.
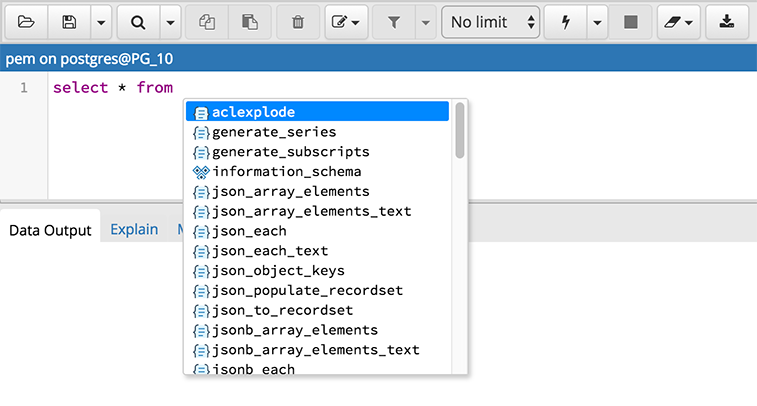
To use autocomplete, begin typing your query; when you would like the Query editor to suggest object names or commands that might be next in your query, press the Control+Space key combination. For example, type "*SELECT * FROM* " (without quotes, but with a trailing space), and then press the Control+Space key combination to select from a popup menu of autocomplete options.
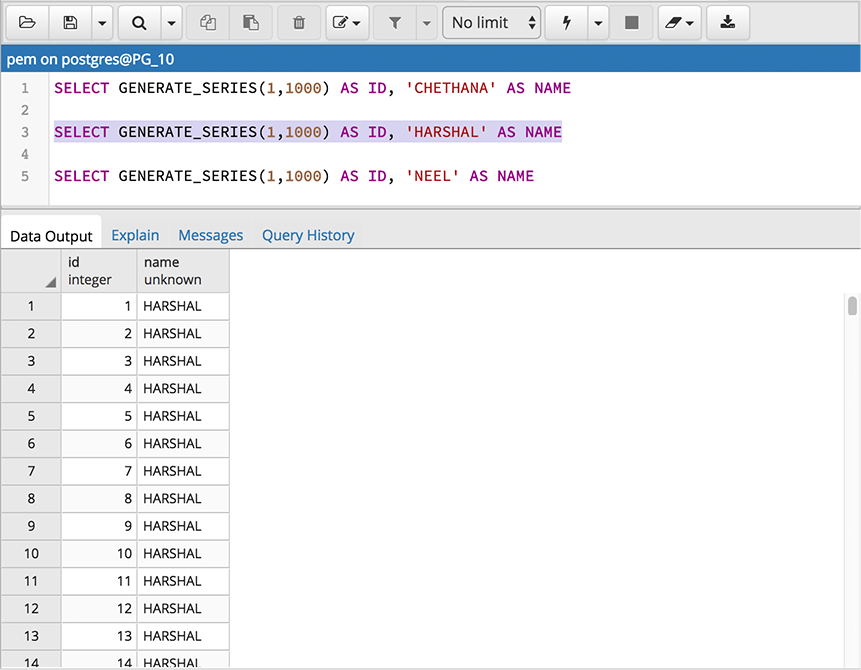
After entering a query, select the Execute/Refresh icon from the toolbar. The complete contents of the SQL editor panel will be sent to the database server for execution. To execute only a section of the code that is displayed in the SQL editor, highlight the text that you want the server to execute, and click the Execute/Refresh icon.
The message returned by the server when a command executes is displayed on the Messages tab. If the command is successful, the Messages tab displays execution details.
Options on the Edit menu offer functionality that helps with code formatting and commenting:
- The auto-indent feature will automatically indent text to the same depth as the previous line when you press the Return key.
- Block indent text by selecting two or more lines and pressing the Tab key.
- Implement or remove SQL style or toggle C style comment notation within your code.
The Data Output Panel
The Data Output panel displays data and statistics generated by the most recently executed query.
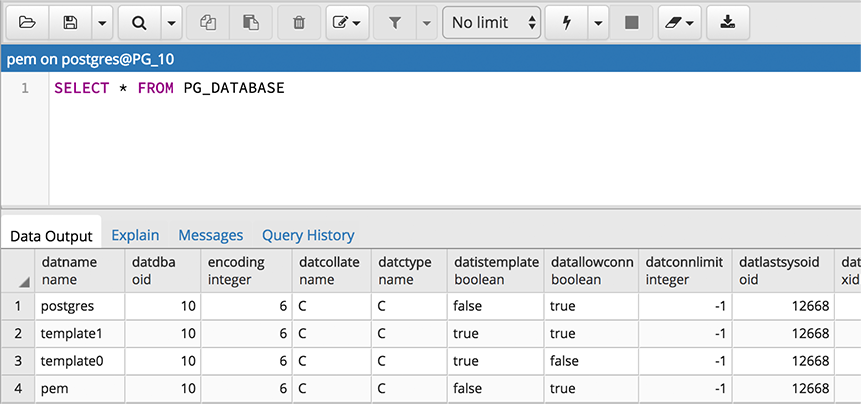
The Data Output tab displays the result set of the query in a table format. You can:
- Select and copy from the displayed result set.
- Use the Execute/Refresh options to retrieve query execution information and set query execution options.
- Use the Download as CSV icon to download the content of the Data Output tab as a comma-delimited file.
All rowsets from previous queries or commands that are displayed in the Data Output panel will be discarded when you invoke another query; open another query tool browser tab to keep your previous results available.
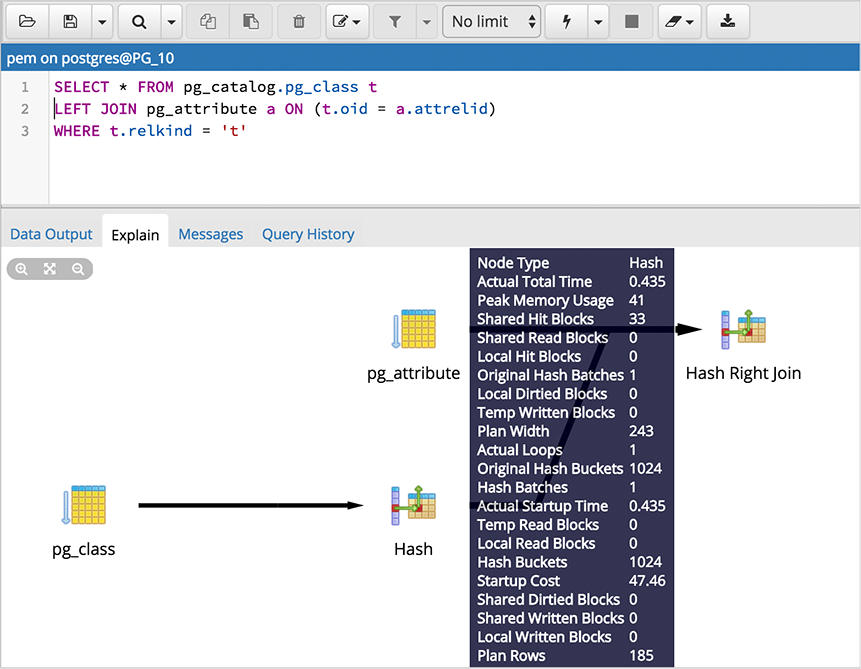
Use the Explain tab to view a graphical representation of a query:
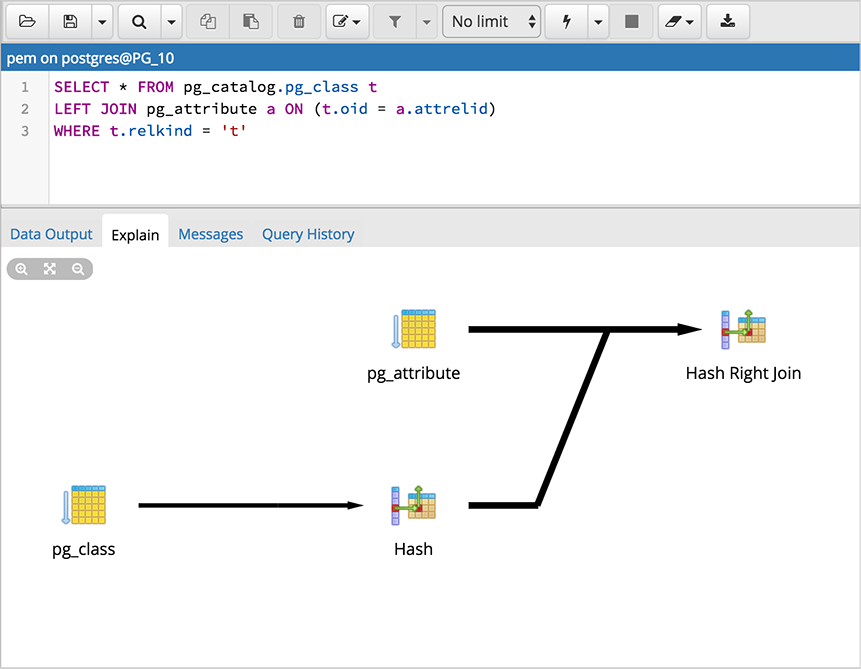
To generate a graphical explain diagram, open the Explain tab, and select Explain , Explain Analyze , or one or more options from the Explain options menu on the Execute/Refresh drop-down. Please note that EXPLAIN VERBOSE cannot be displayed graphically. Hover over an icon on the Explain tab to review information about that item; a popup window will display information about the selected object:
Note that the query plan that accompanies the Explain analyze is available on the Data Output tab.
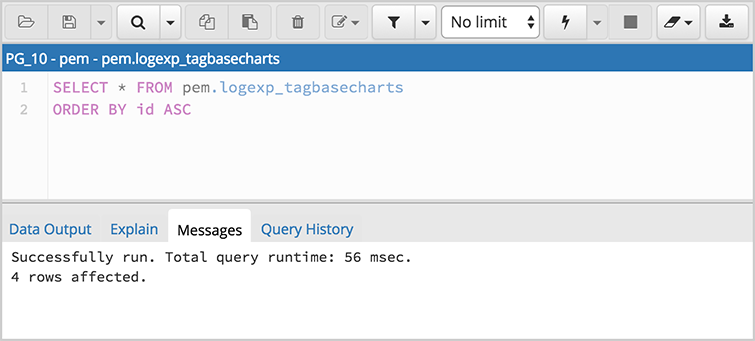
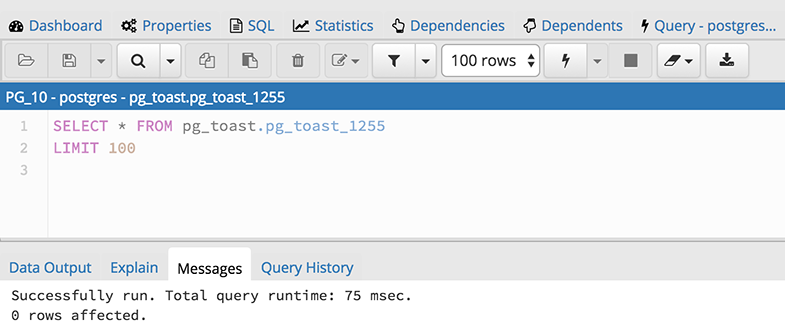
Use the Messages tab to view information about the most recently executed query:
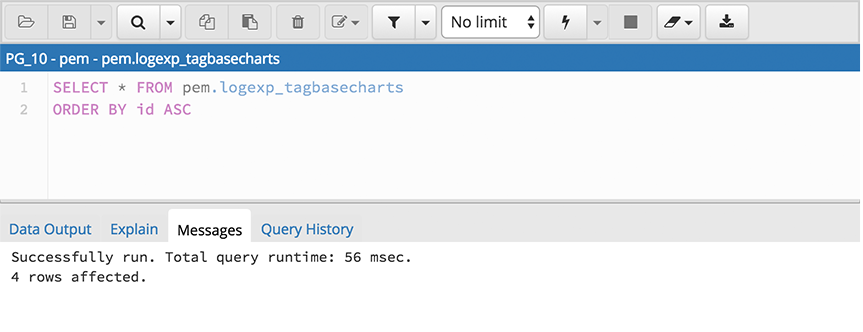
If the server returns an error, the error message will be displayed on the Messages tab, and the syntax that caused the error will be underlined in the SQL editor. If a query succeeds, the Messages tab displays how long the query took to complete and how many rows were retrieved:
Use the Query History tab to review activity for the current session:
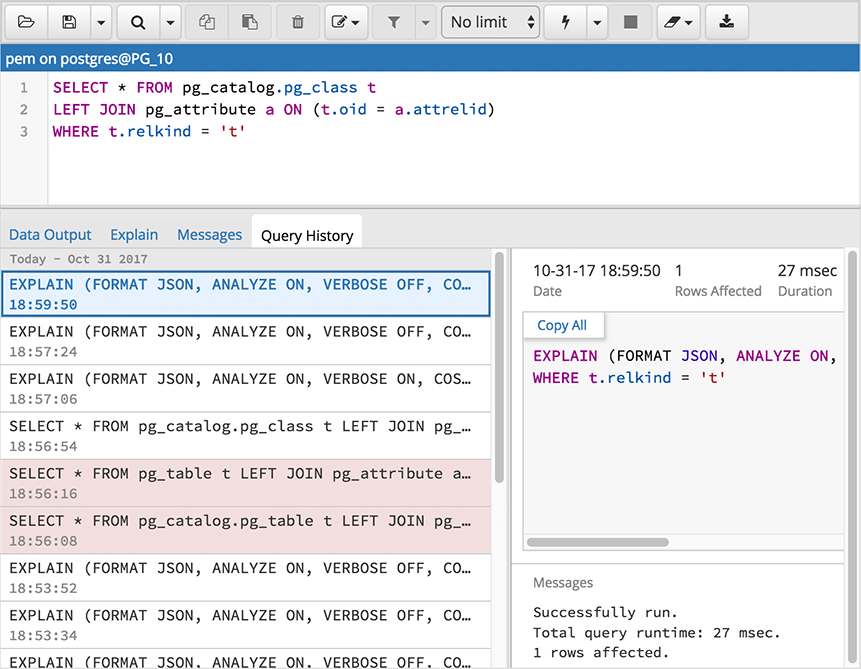
The Query History tab displays information about recent commands:
- The date and time that a query was invoked.
- The text of the query.
- The number of rows returned by the query.
- The amount of time it took the server to process the query and return a result set.
- Messages returned by the server (not noted on the Messages tab).
To erase the content of the Query History tab, select Clear history from the Clear drop-down menu.
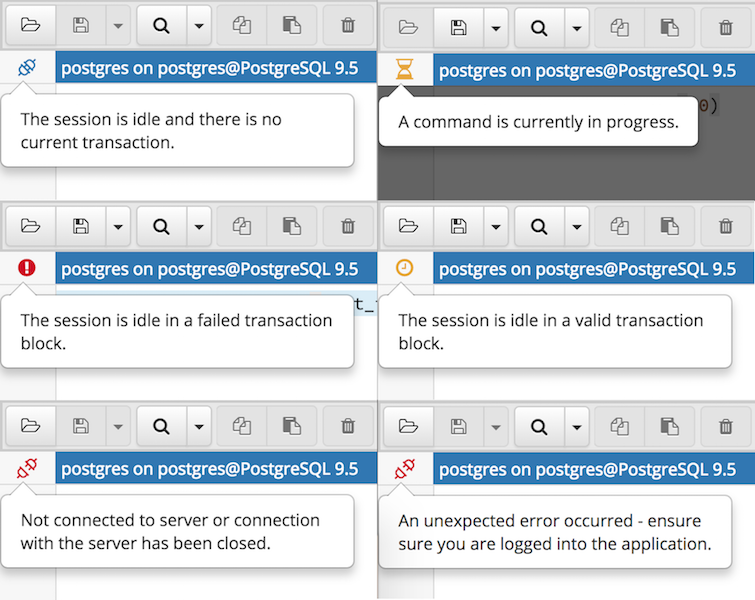
Use the Connection status feature to view the current connection and transaction status by clicking on the status icon in query tool: