Setting up Grafana
There are RPM packages available to Crunchy Data customers through the Crunchy Customer Portal. Otherwise the Grafana RPM Package can be downloaded and installed from https://grafana.com/grafana/download. There is no difference between the Crunchy provided package and the one directly from Grafana. Windows Server 2012R2 packges are available directly from Crunchy Data to customers.
Installation
Linux
With RPM Packages
There are RPM packages available to Crunchy Data customers through the Crunchy Customer Portal.
If you install the below available packages with RPM, you can continue reading at the Setup section.
Available Packages
| Package Name | Description |
|---|---|
| grafana | Base package for grafana |
| pgmonitor-grafana-extras | Crunchy configurations for datasource & dashboard provisioning |
Without Packages
Create the following directories on your grafana server if they don’t exist:
mkdir -p /etc/grafana/provisioning/{datasources,dashboards}
mkdir -p /etc/grafana/crunchy_dashboards
| pgmonitor Configuration File | System Location |
|---|---|
| grafana/crunchy_grafana_datasource.yml | /etc/grafana/provisioning/datasources/datasource.yml |
| grafana/crunchy_grafana_dashboards.yml | /etc/grafana/provisioning/dashboards/dashboards.yml |
Review the crunchy_grafana_datasource.yml file to ensure it is looking at your Prometheus database. The included file assumes Grafana and Prometheus are running on the same system. DO NOT CHANGE the datasource “name” if you will be using the dashboards provided in this repo. They assume that name and will not work otherwise. Any other options can be changed as needed. Save the crunchy_grafana_datasource.yml file and rename it to /etc/grafana/provisioning/datasources/datasources.yml. Restart grafana and confirm through the web interface that the datasource was provisioned and working.
Review the crunchy_grafana_dashboards.yml file to ensure it’s looking at where you stored the provided dashboards. By default it is looking in /etc/grafana/crunchy_dashboards. Save this file and rename it to /etc/grafana/provisioning/dashboards/dashboards.yml. Restart grafana so it picks up the new config.
Save all of the desired .json dashboard files to the /etc/grafana/crunchy_dashboards folder. All of them are not required, so if there is a dashboard you do not need, it can be left out.
Windows Server 2012R2
Grafana and Prometheus are currently both installed together on Windows via the Crunchy Data installer. Please refer to the Prometheus setup guide for installation details. Once installed, follow the configuration steps below.
Upgrading
If you’d like to take advantage of the new provisioning system in Grafana 5 provided by pgmonitor 2.x, we recommend either renaming or deleting your existing datasources and dashboards so there are no issues when the provisioned versions are imported.
When upgrading from pgmonitor 1.x to 2.x, note that many of the system related metric names from node_exporter have had their names changed. The new graphs provided for Grafana 5+ have taken these new names into account. Also, the top level PostgreSQL Overview dashboard no longer uses the ccp_is_ready metric, so you will have to include some new postgres_exporter metrics for that dashboard to work.
Setup
Setup on Linux
Configuration Database
By default Grafana uses an SQLite database to store configuration and dashboard information. We recommend using a PostgreSQL database for better long term scalability. Before doing any further configuration, including changing the default admin password, set the grafana.ini to point to a postgresql instance that has a database created for it.
In psql run the following:
    CREATE ROLE grafana WITH LOGIN;
    CREATE DATABASE grafana;
    ALTER DATABASE grafana OWNER TO grafana;
    \password grafana
You may also need to adjust your pg_hba.conf to allow grafana to connect to your database.
In your grafana.ini, set the following options at a minimum with relevant values:
[database]

type = postgres
host = 127.0.0.1:5432
name = grafana
user = grafana
password = """mypassword"""
Now enable and start the grafana service
sudo systemctl enable grafana-server
sudo systemctl start grafana-server
sudo systemctl status grafana-server
Navigate to the web interface: https://<ip-address>:3000. Log in with admin/admin (be sure to change the admin password) and check settings to ensure the postgres options have been set and are working.
Datasource & Dashboard Provisioning
Grafana 5.x provides the ability to automatically provision datasources and dashboards via configuration files instead of having to manually import them either through the web interface or the API. Note that provisioned dashboards can no longer be directly edited and saved via the web interface. See the Grafana documentation for how to edit/save provisioned dashboards: http://docs.grafana.org/administration/provisioning/#making-changes-to-a-provisioned-dashboard. If you’d like to customize these dashboards, we recommend first adding them via provisioning then saving them with a new name. You can then either manage them via the web interface or add them to the provisioning system.
The extras package takes care of putting all these files in place. If you did not use the crunchy package to install grafana, see the additional instructions above. Once that is done, the only additional setup that needs to be done is to set the “provisioning” option in the grafana.ini to point to the top level directory if it hasn’t been done already. If you’re upgrading from Grafana 4.x to 5.x, you will have to add the “provisioning” option to the [paths] section of the grafana.ini file. Once that is done, just restart grafana and all datasources and dashboards should appear.
[paths]
provisioning = /etc/grafana/provisioning
Setup on Windows Server 2012R2
Grafana is installed and configured to use the default Crunchy-provided Prometheus datasource and the Crunchy-provided dashboards automatically. We simply need to set the default admin user’s password and verify that the dashboards are functional:
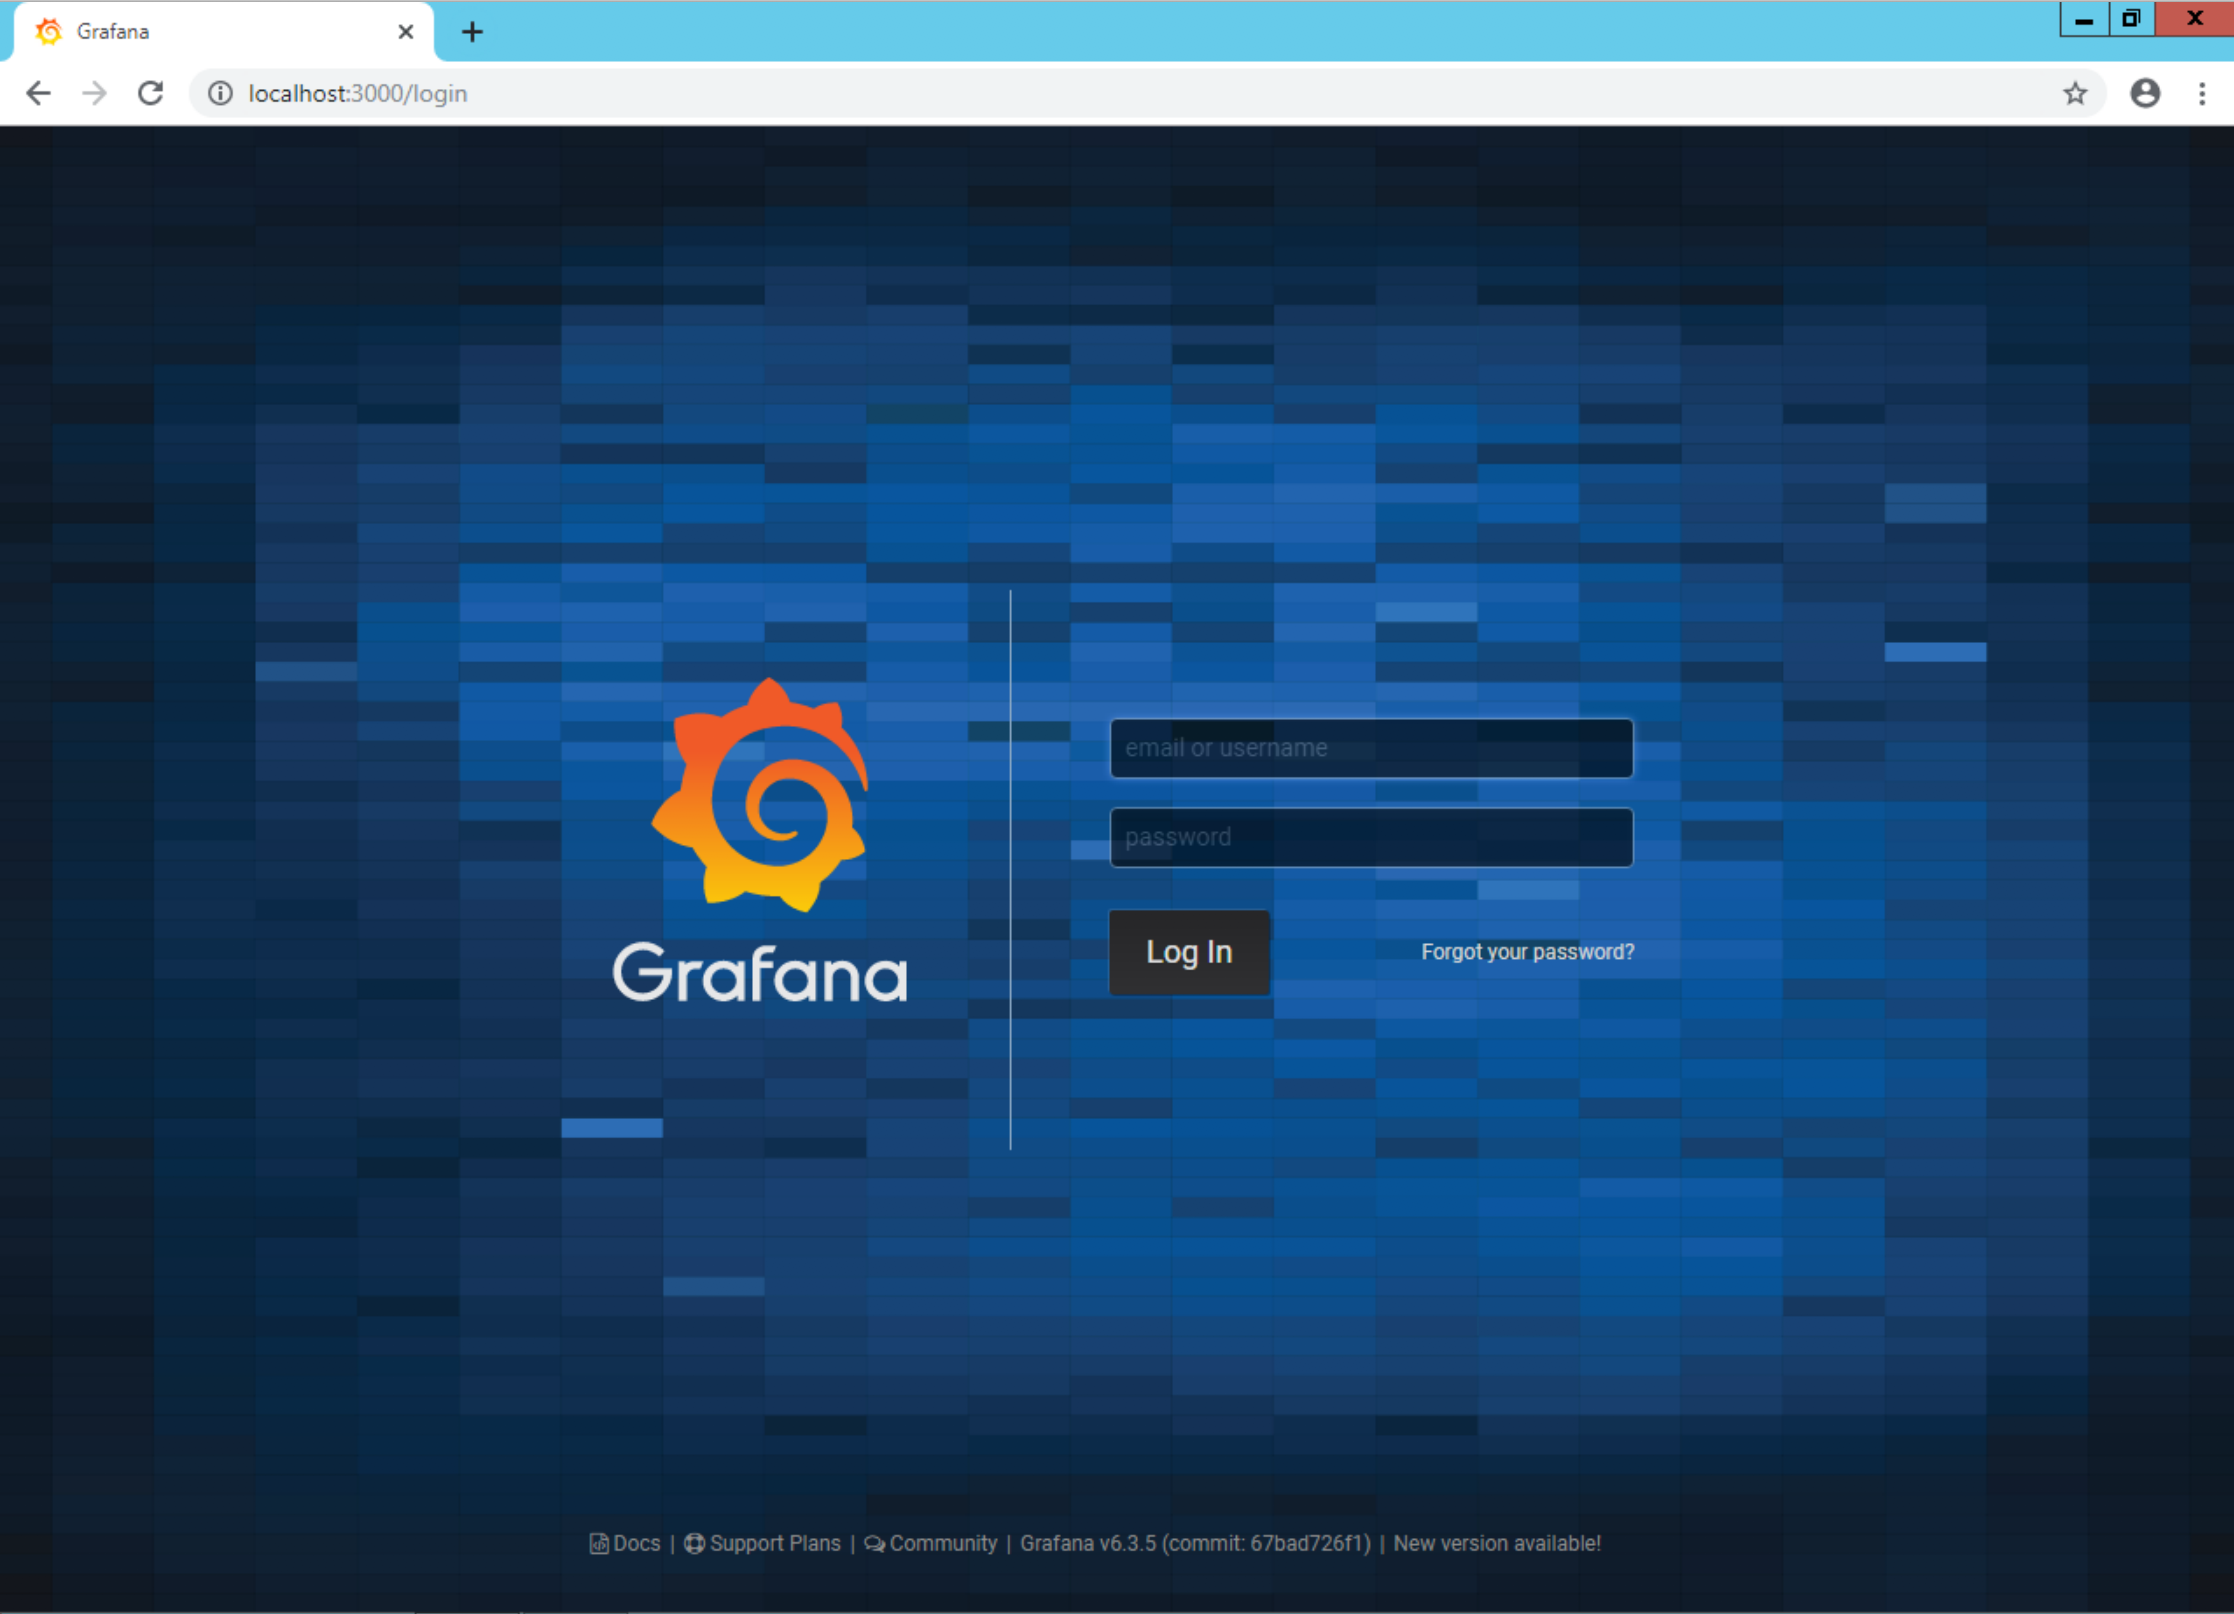
Load the Grafana UI in your browser by visiting http://localhost:3000:
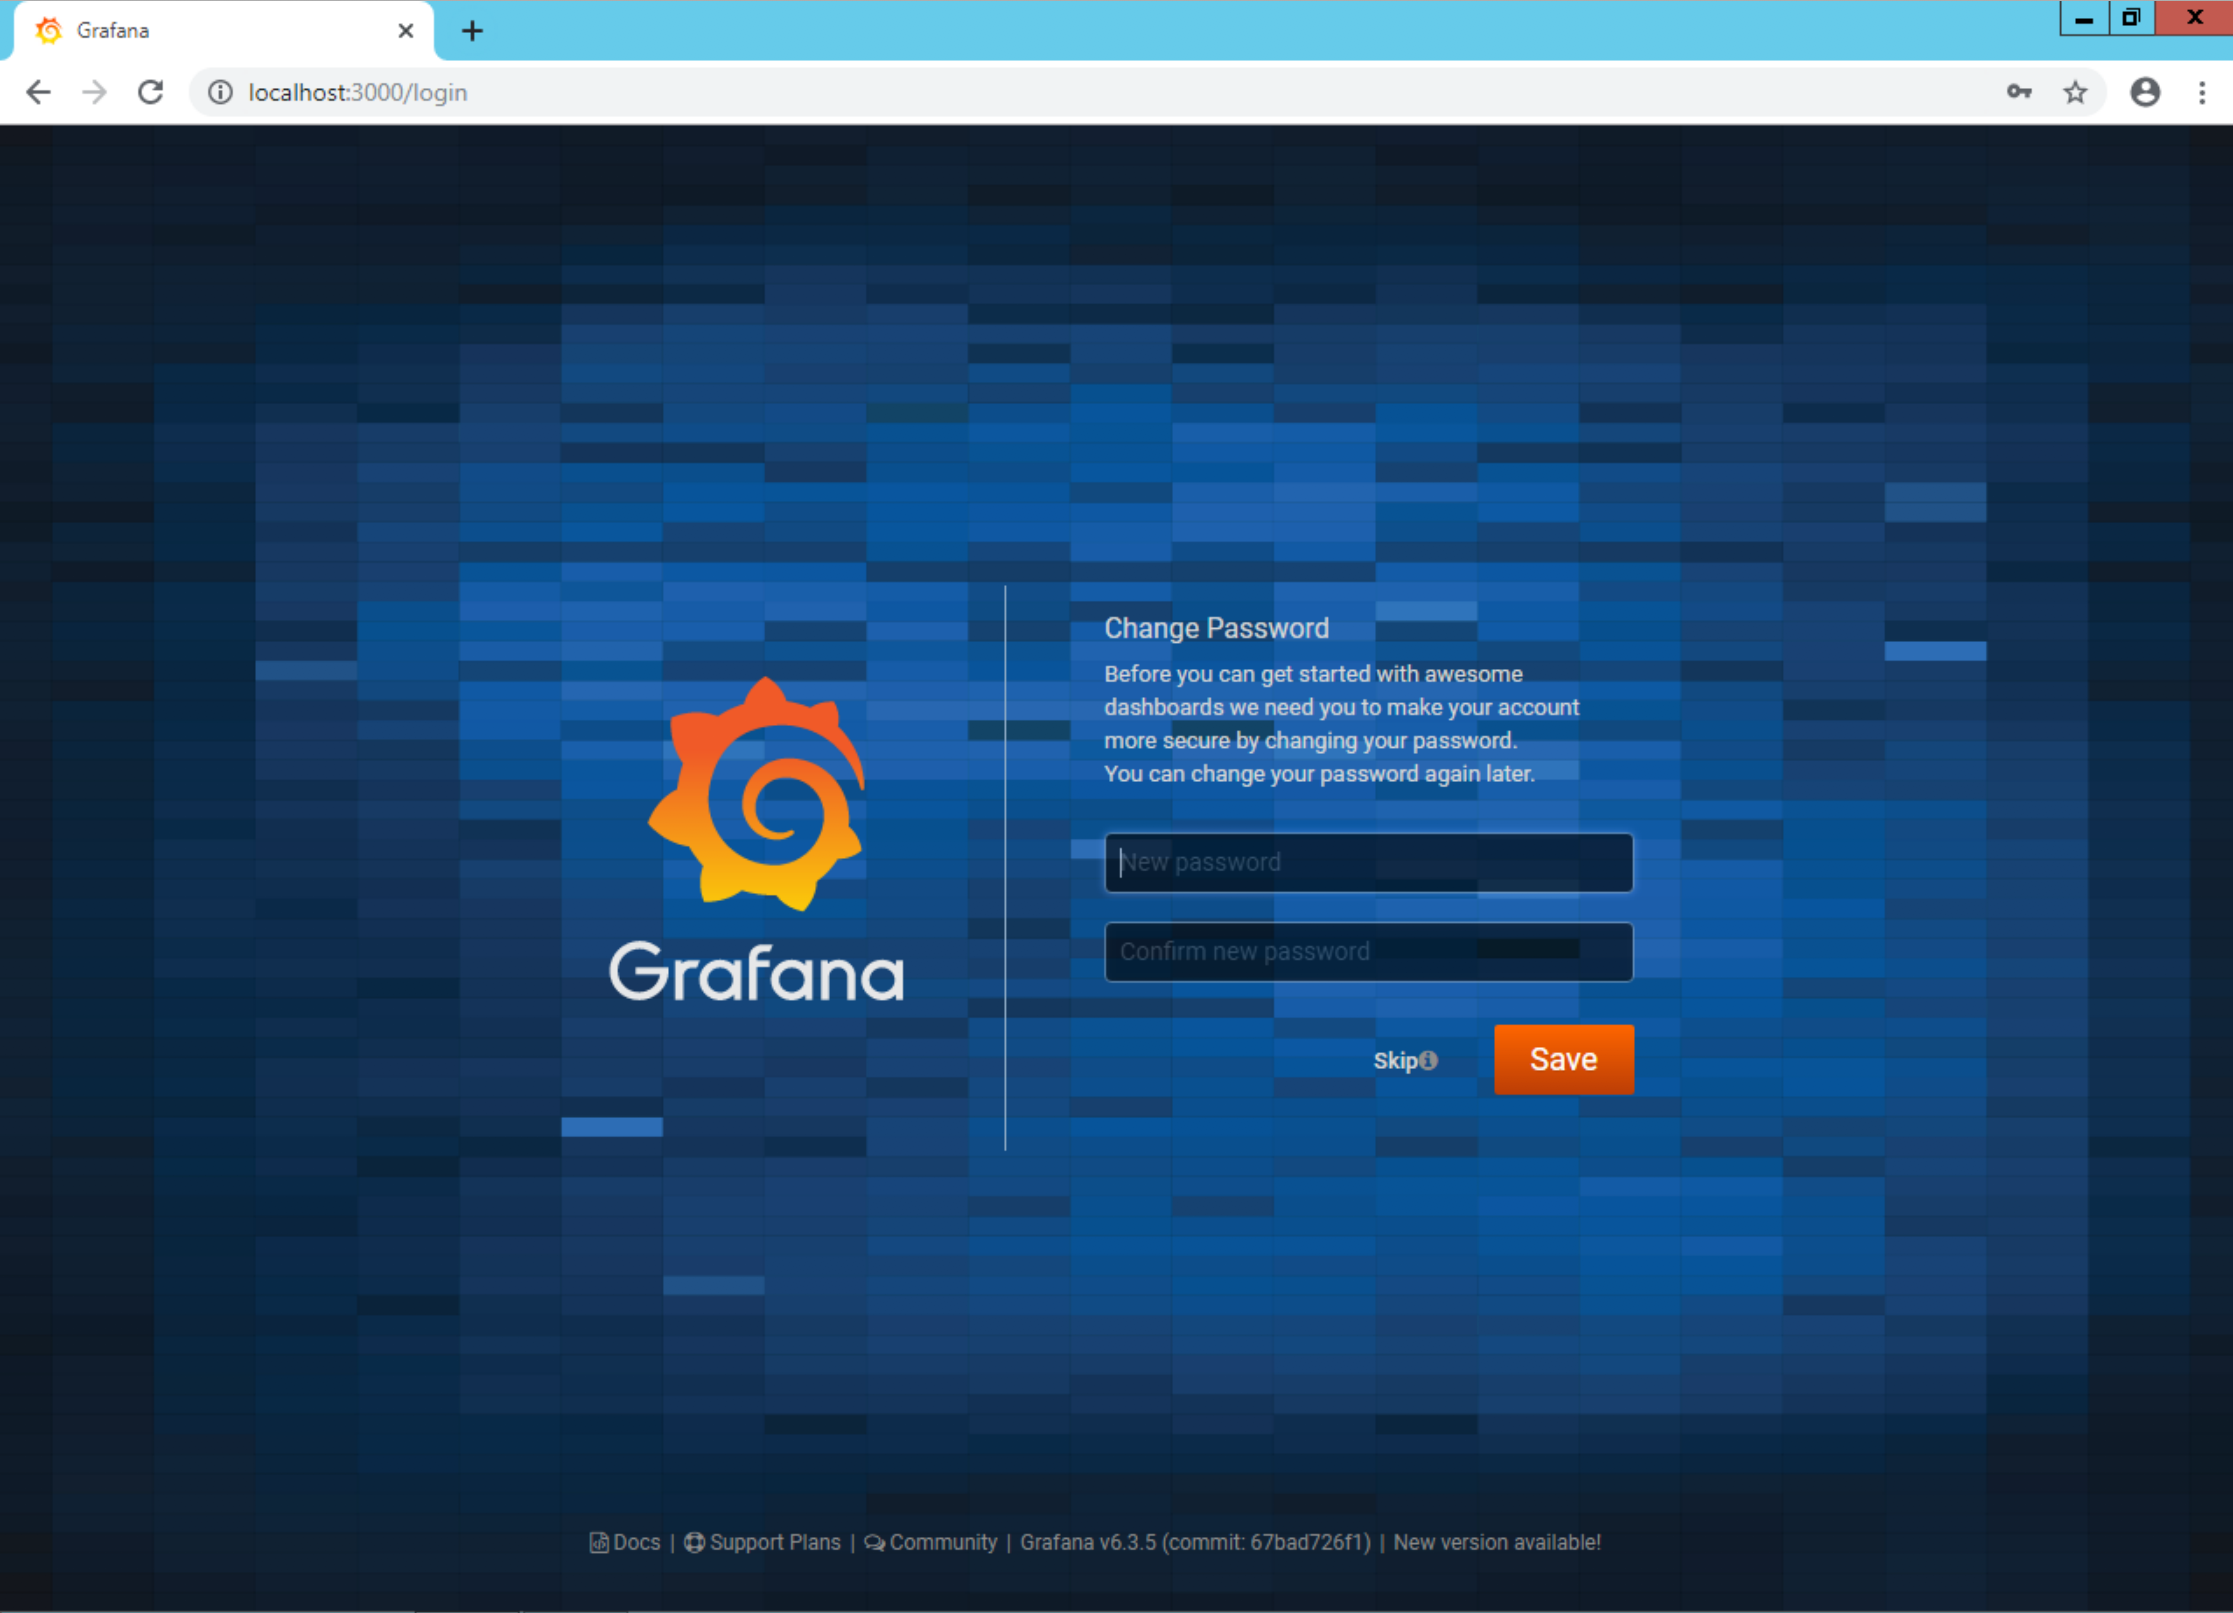
After entering ‘admin’ as both the user and password, you are prompted to change the password before continuing:
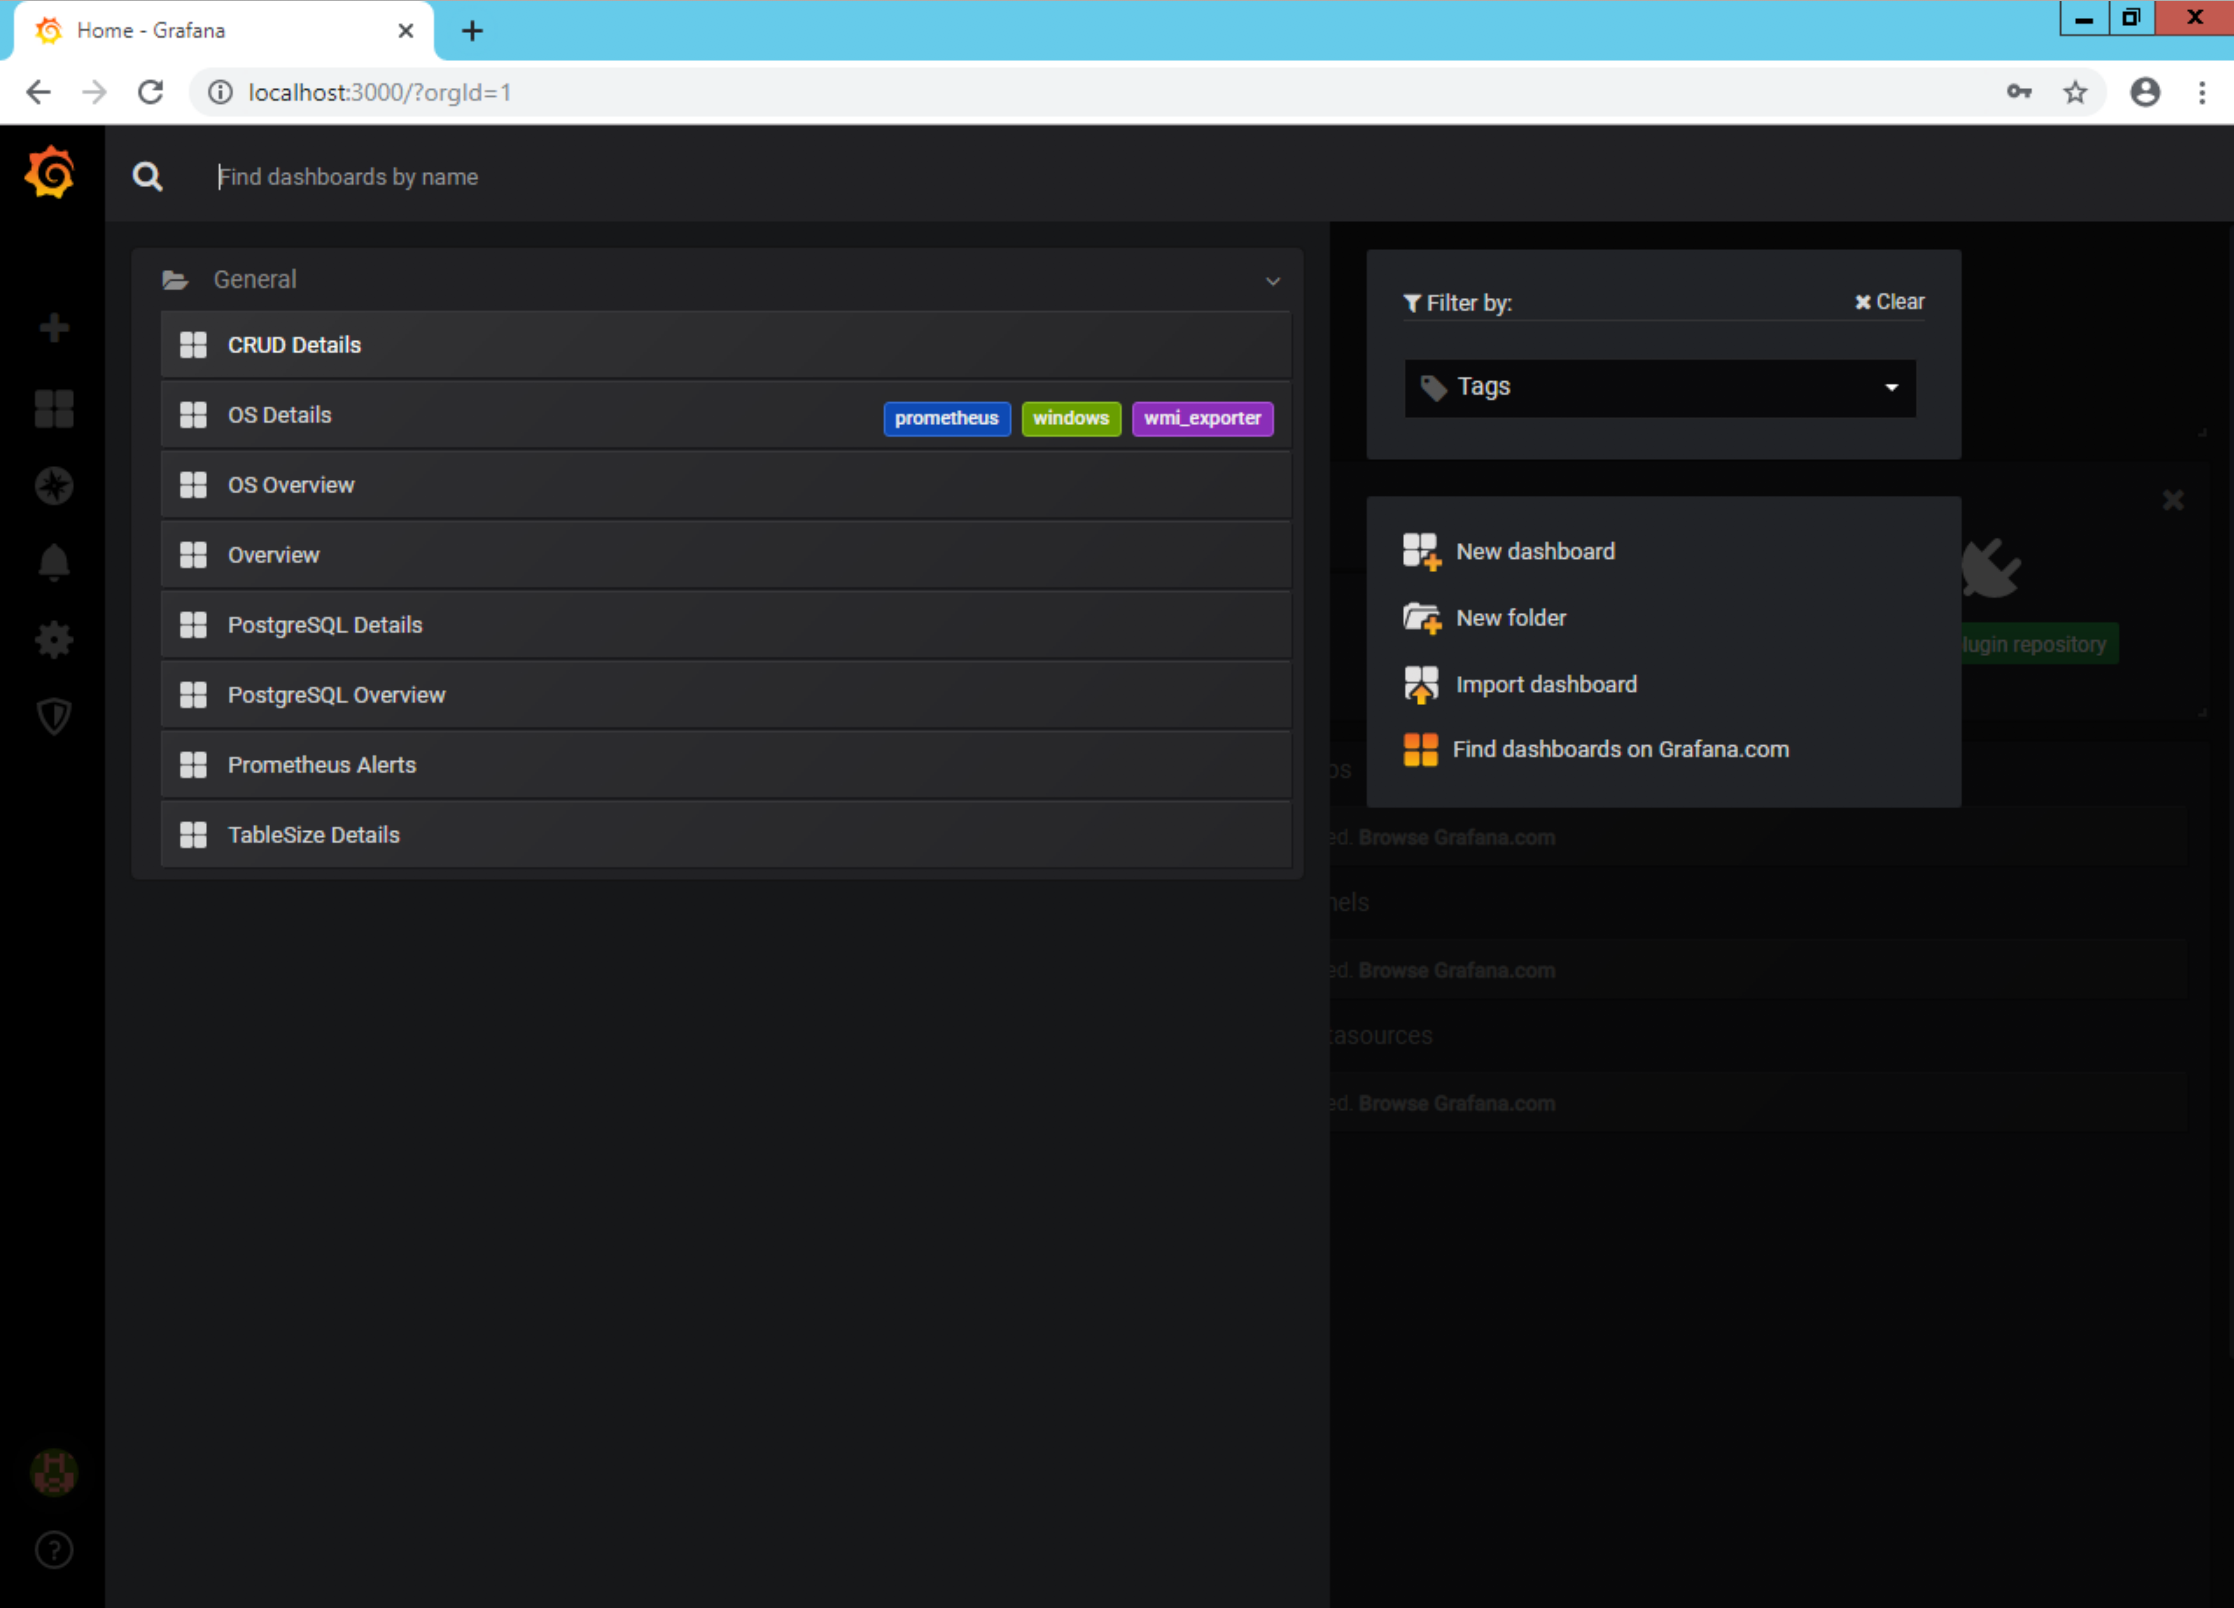
After changing the password, you are logged in and taken to the Home Dashboard. Here you can see the first three items are stricken-through indicating they are already completed. You can now optionally add users or plugins to you installation (we won’t cover either of these steps):
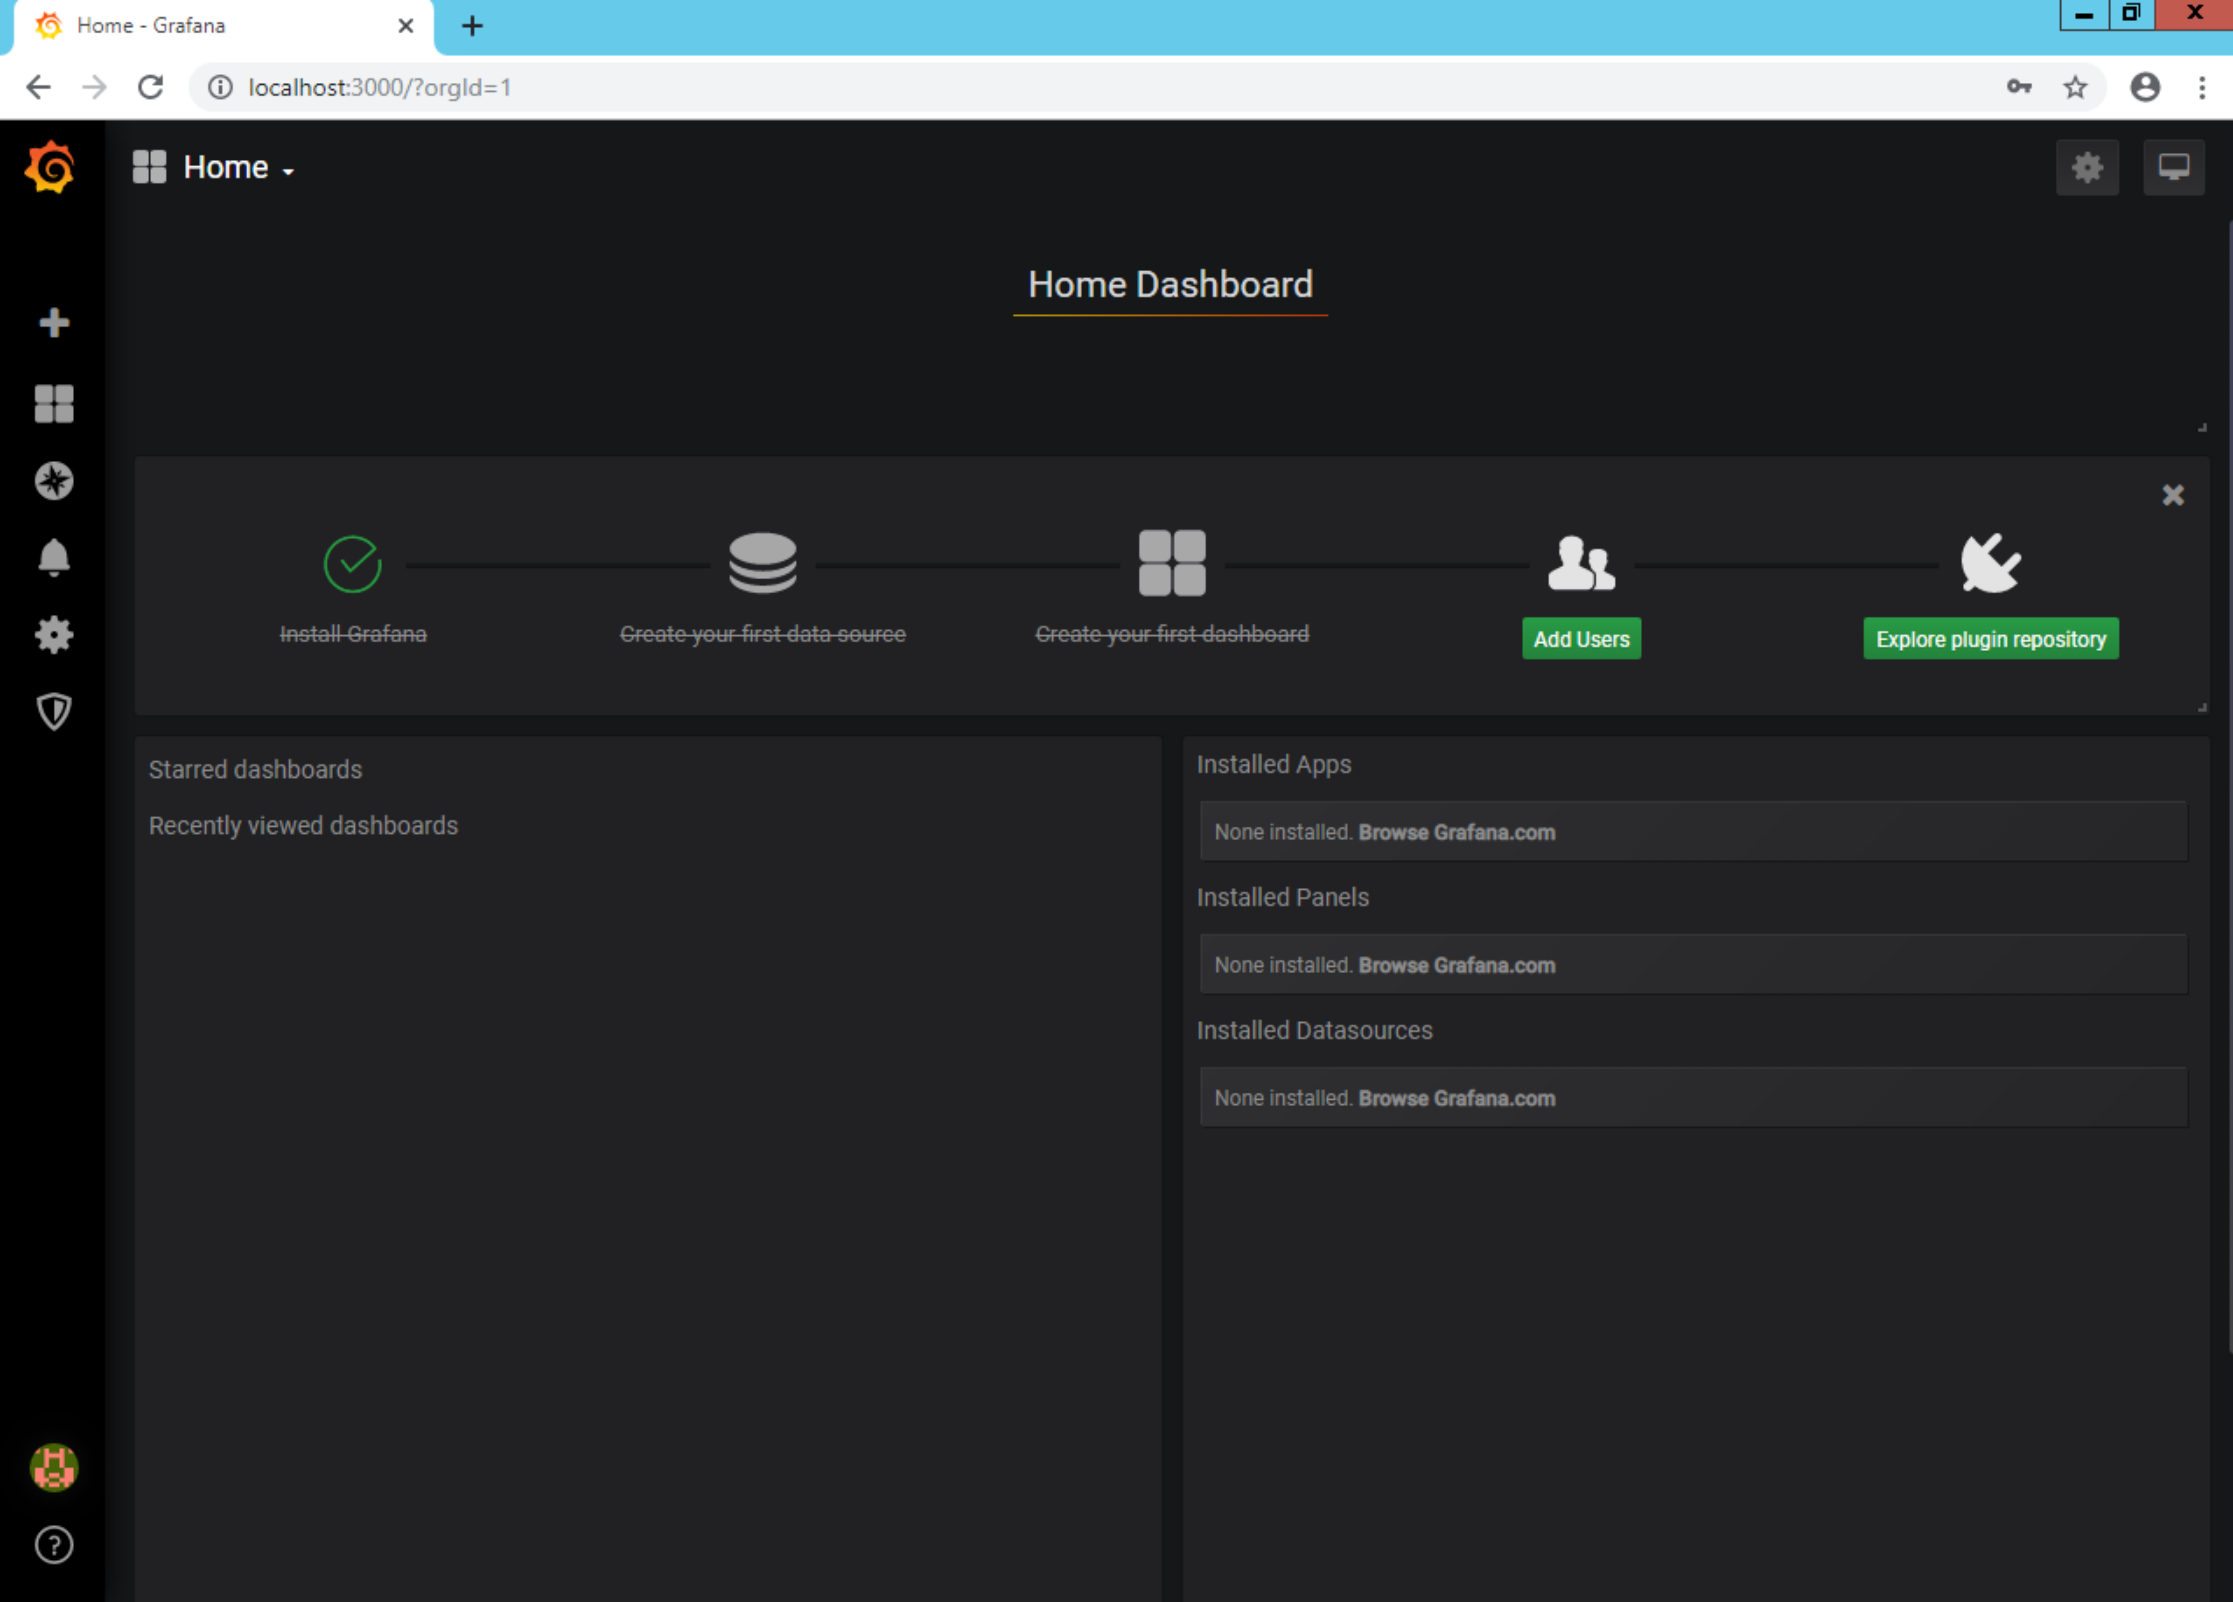
Click the dashboard selector in the top left of the screen that currently has the four squares, the word Home, and the downward-facing triangle to see the list of installed dashboards:
Select the ‘Overview’ dashboard from the available choices. This is the ‘main’ dashboard:
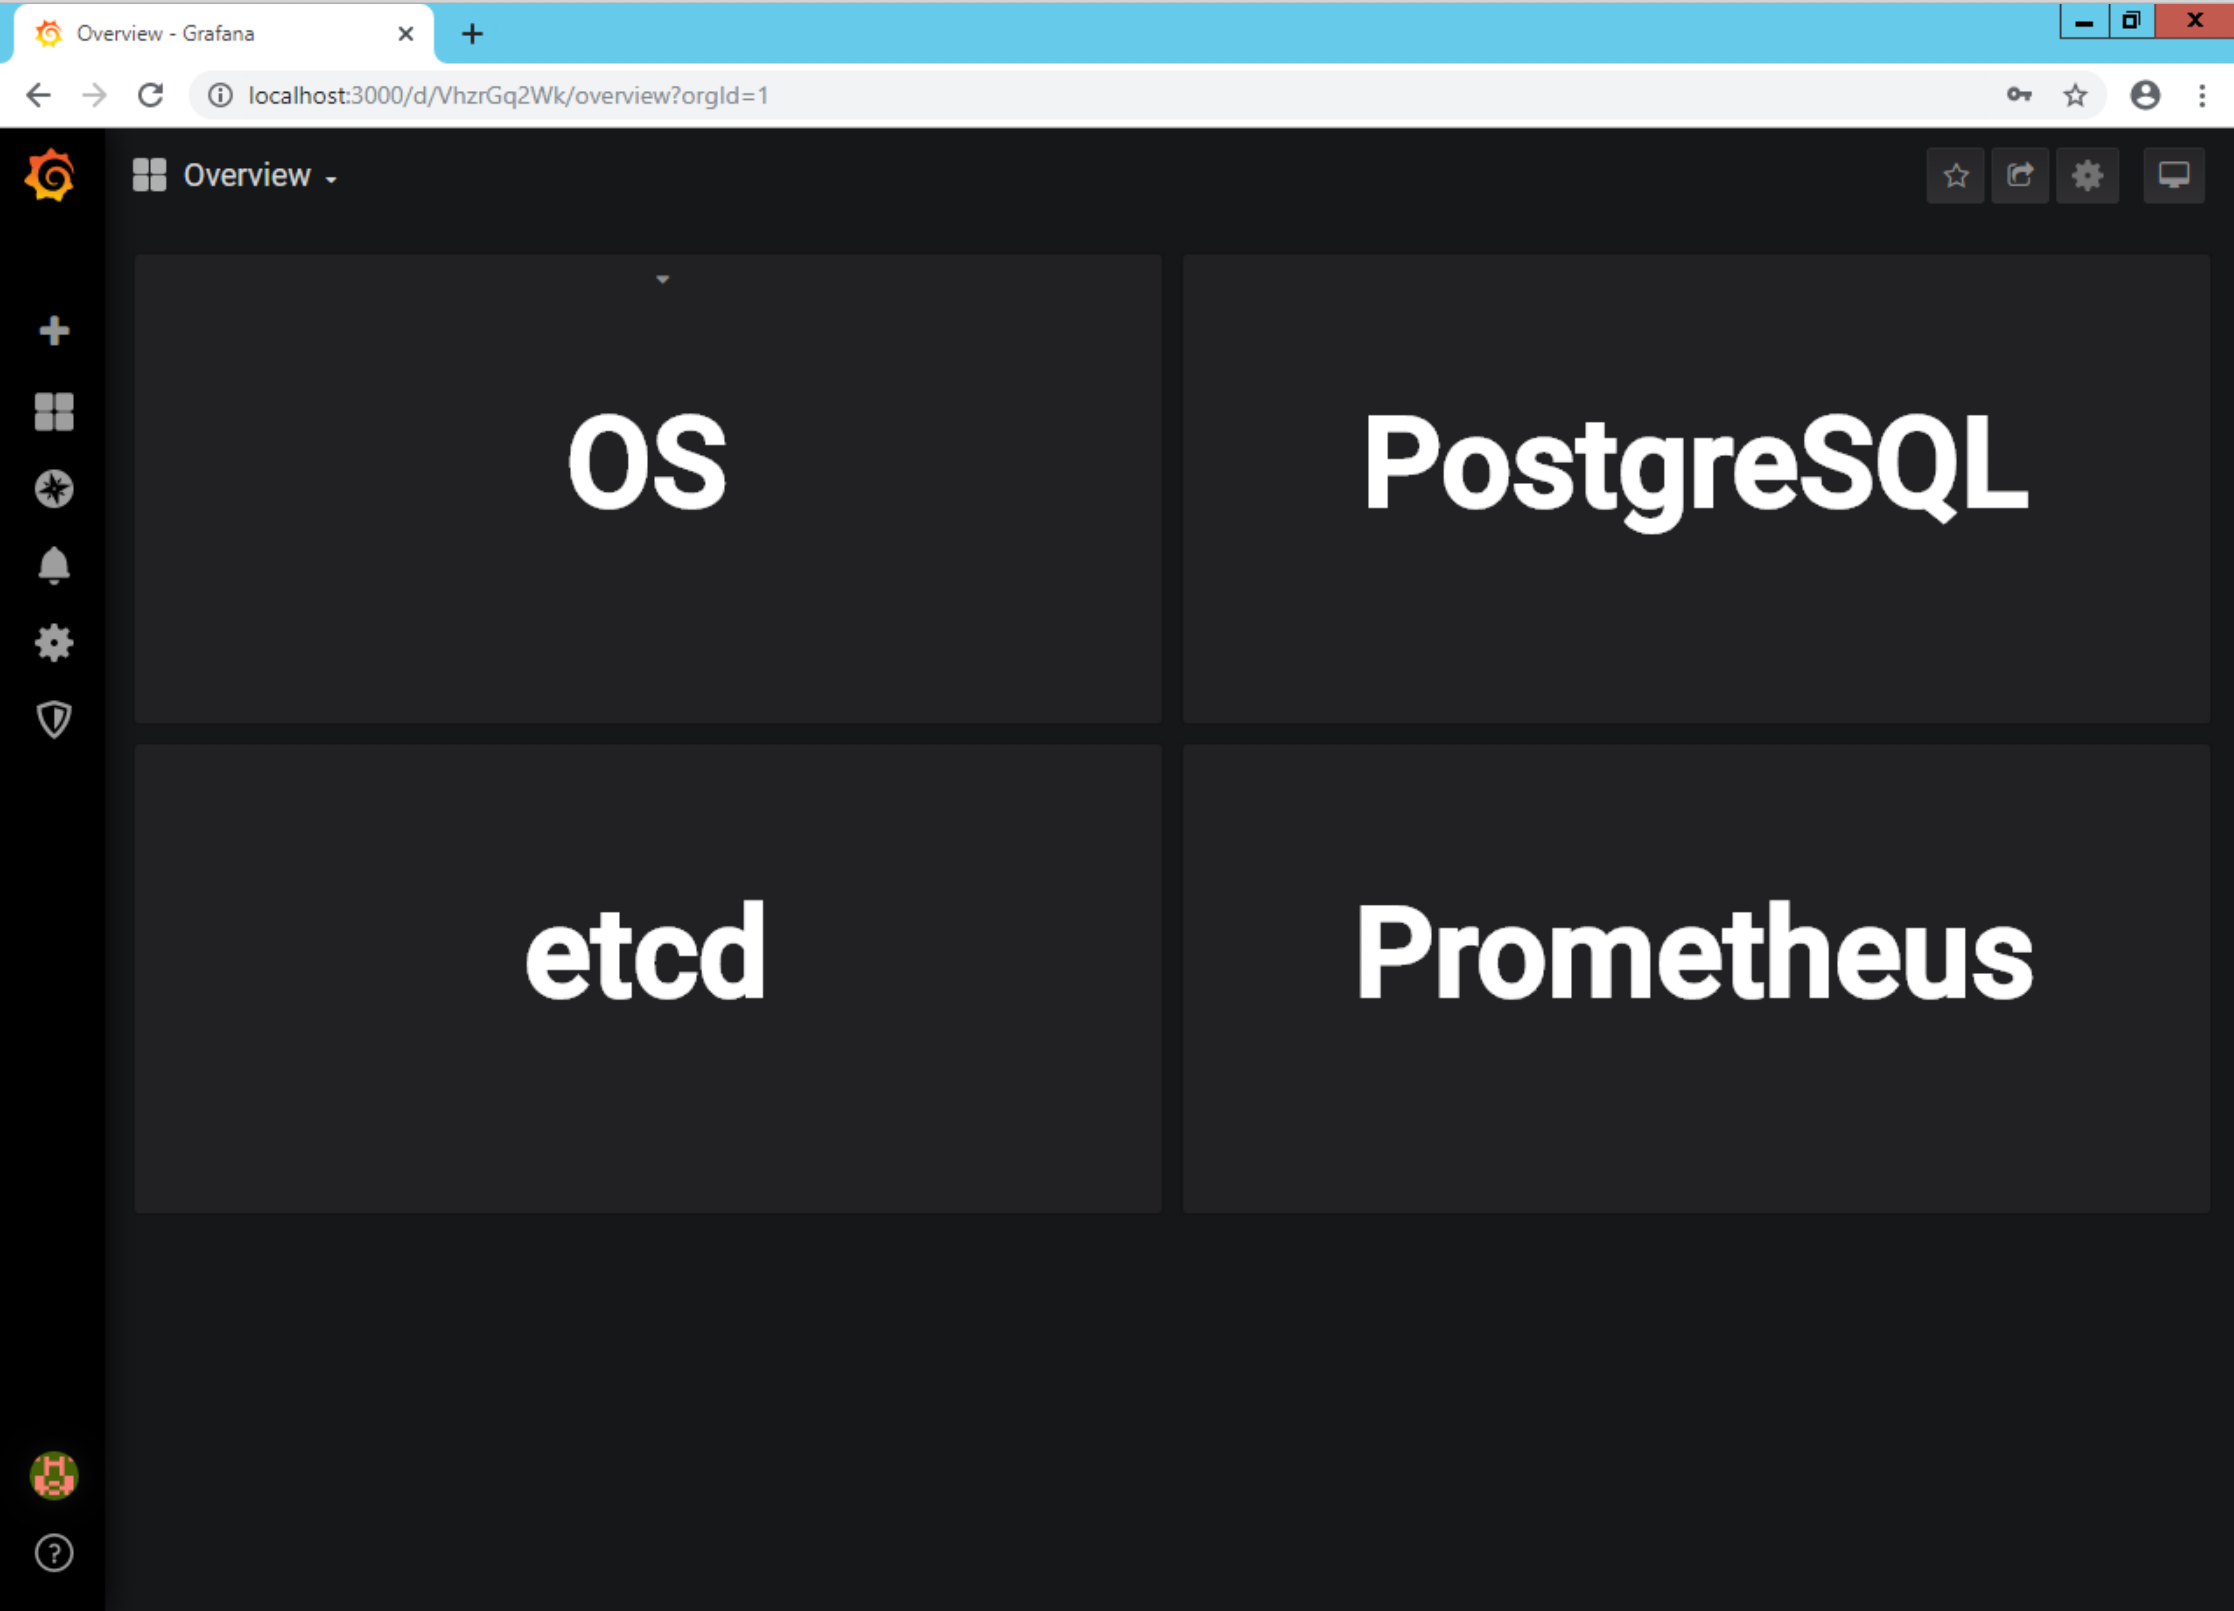
Click on the ‘OS’ square to load the ‘OS Overview’ dashboard:
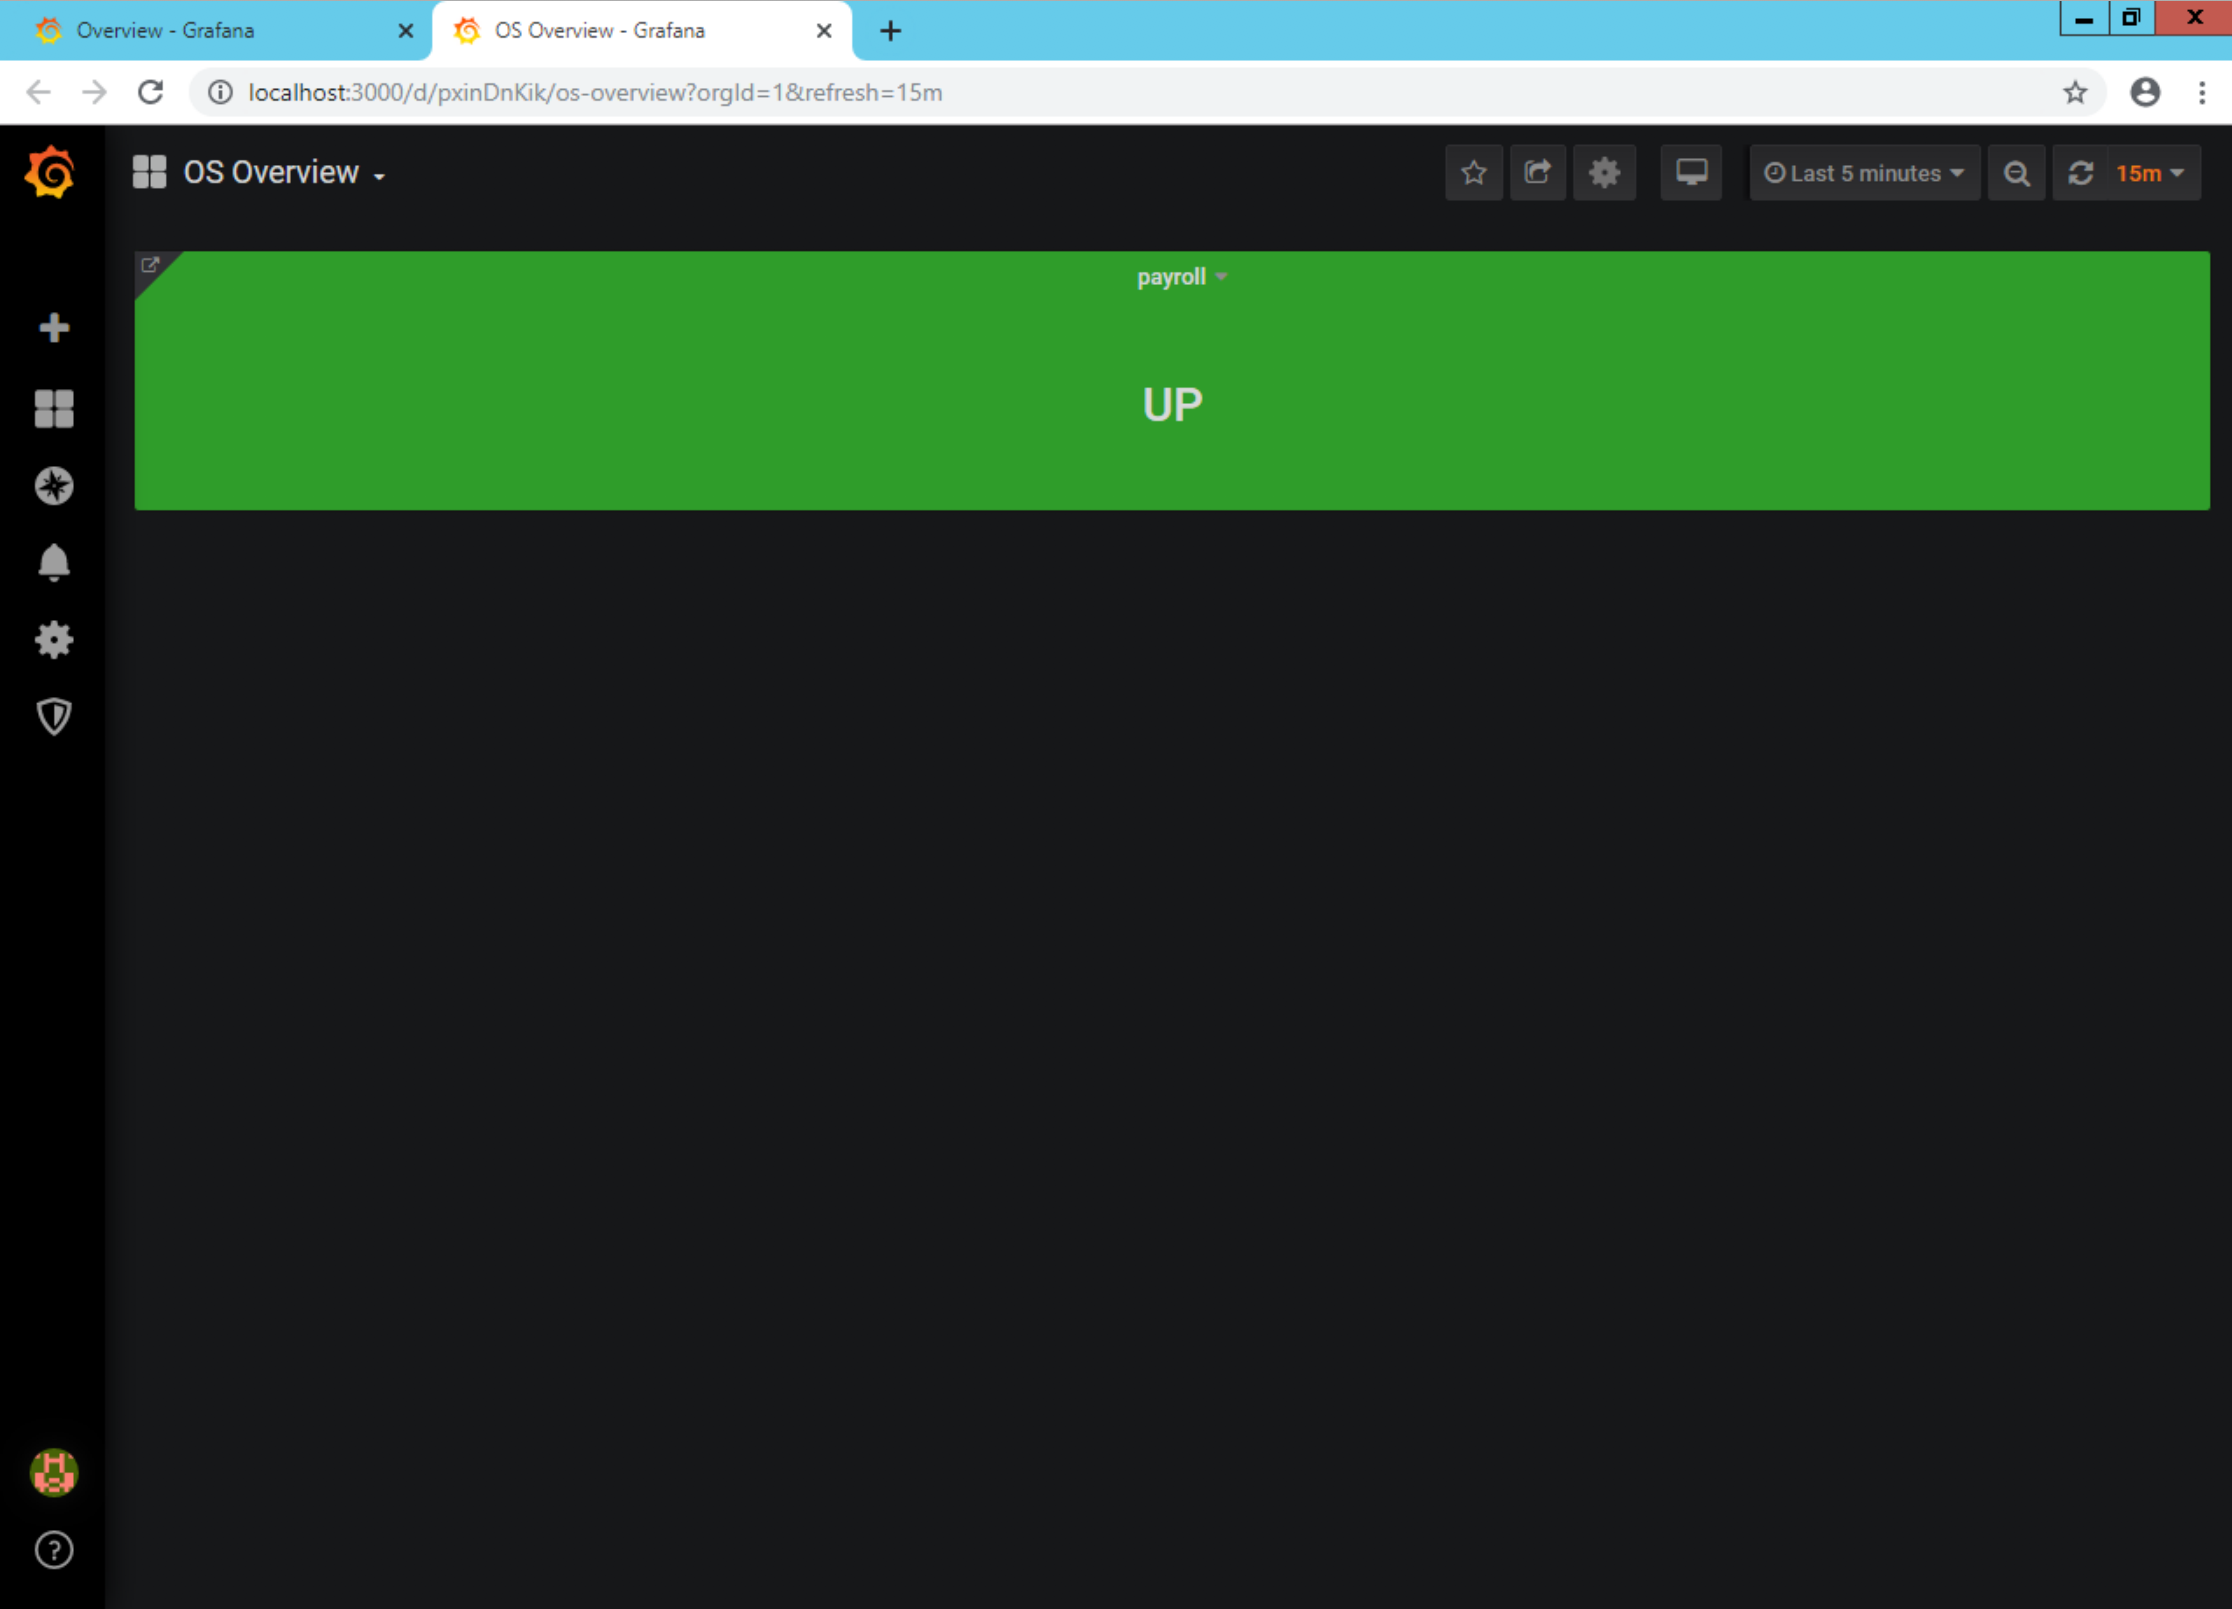
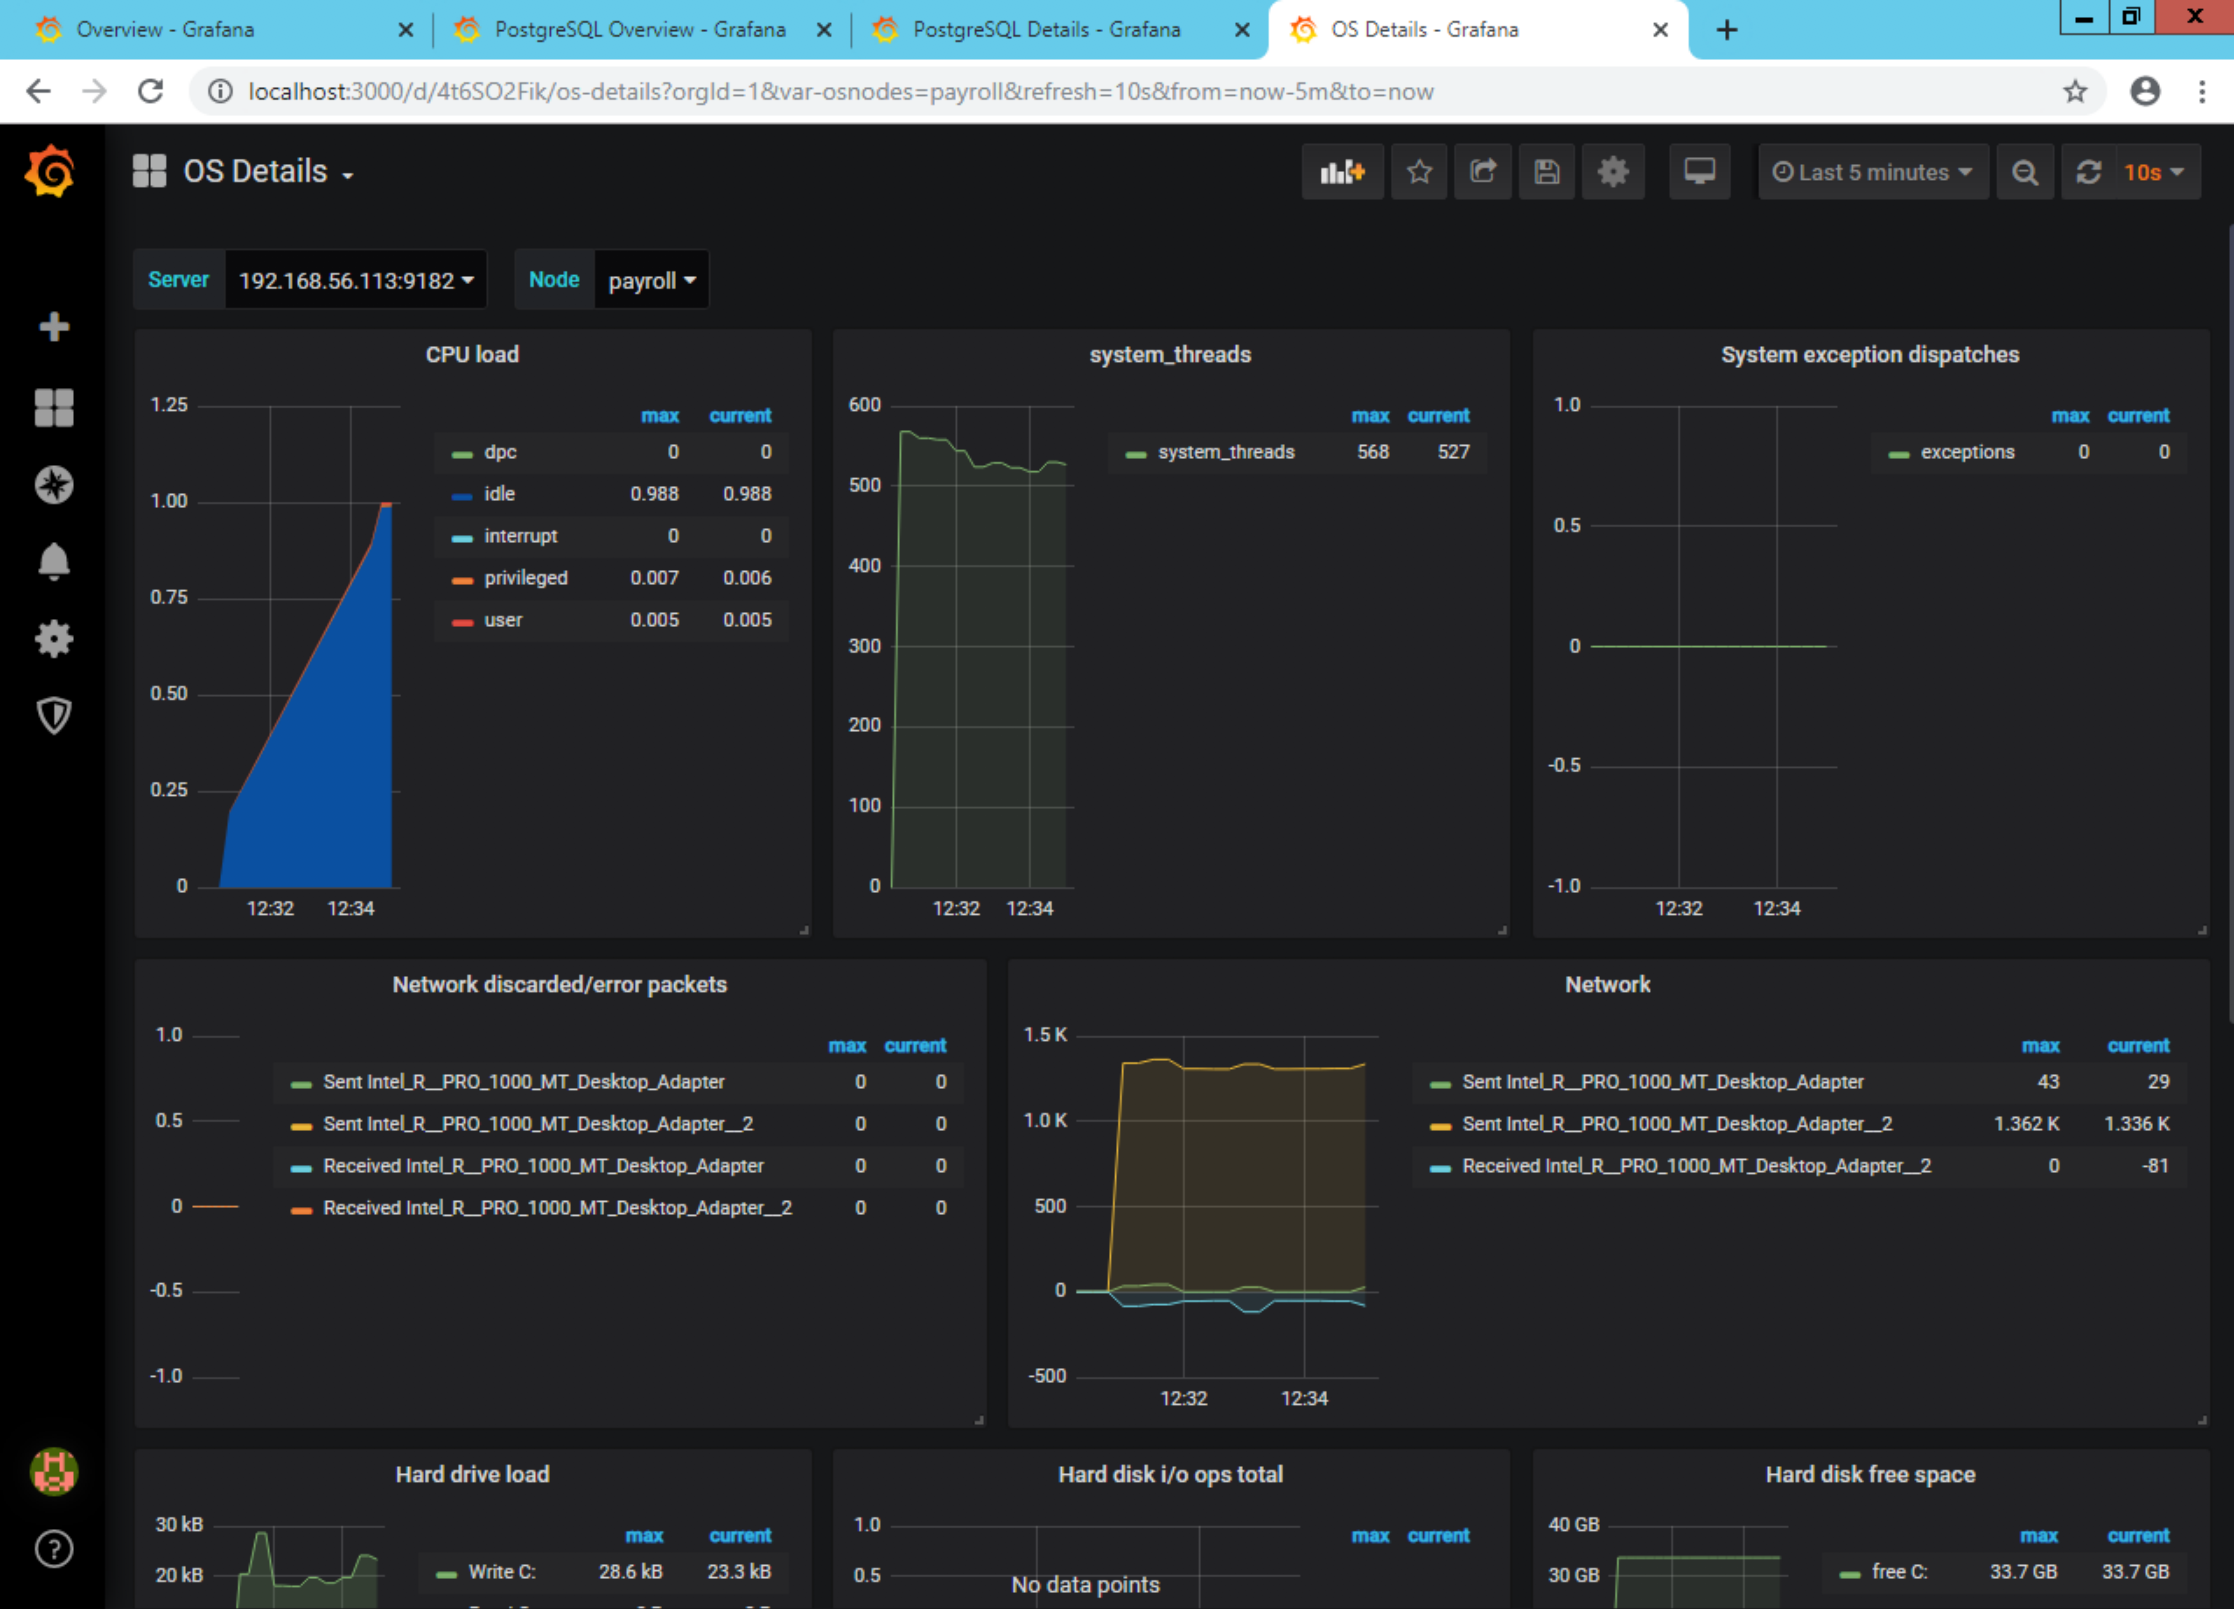
This dashboard shows you whether the host(s) you’re monitoring are UP or DOWN. Click on a given host to load the ‘OS Details’ dashboard for that host:
From the ‘Overview’ dashboard, clicking the ‘PostgreSQL’ square will load the ‘PostgreSQL Overview’ dashboard showing which monitored PostgreSQL instances are up or down:
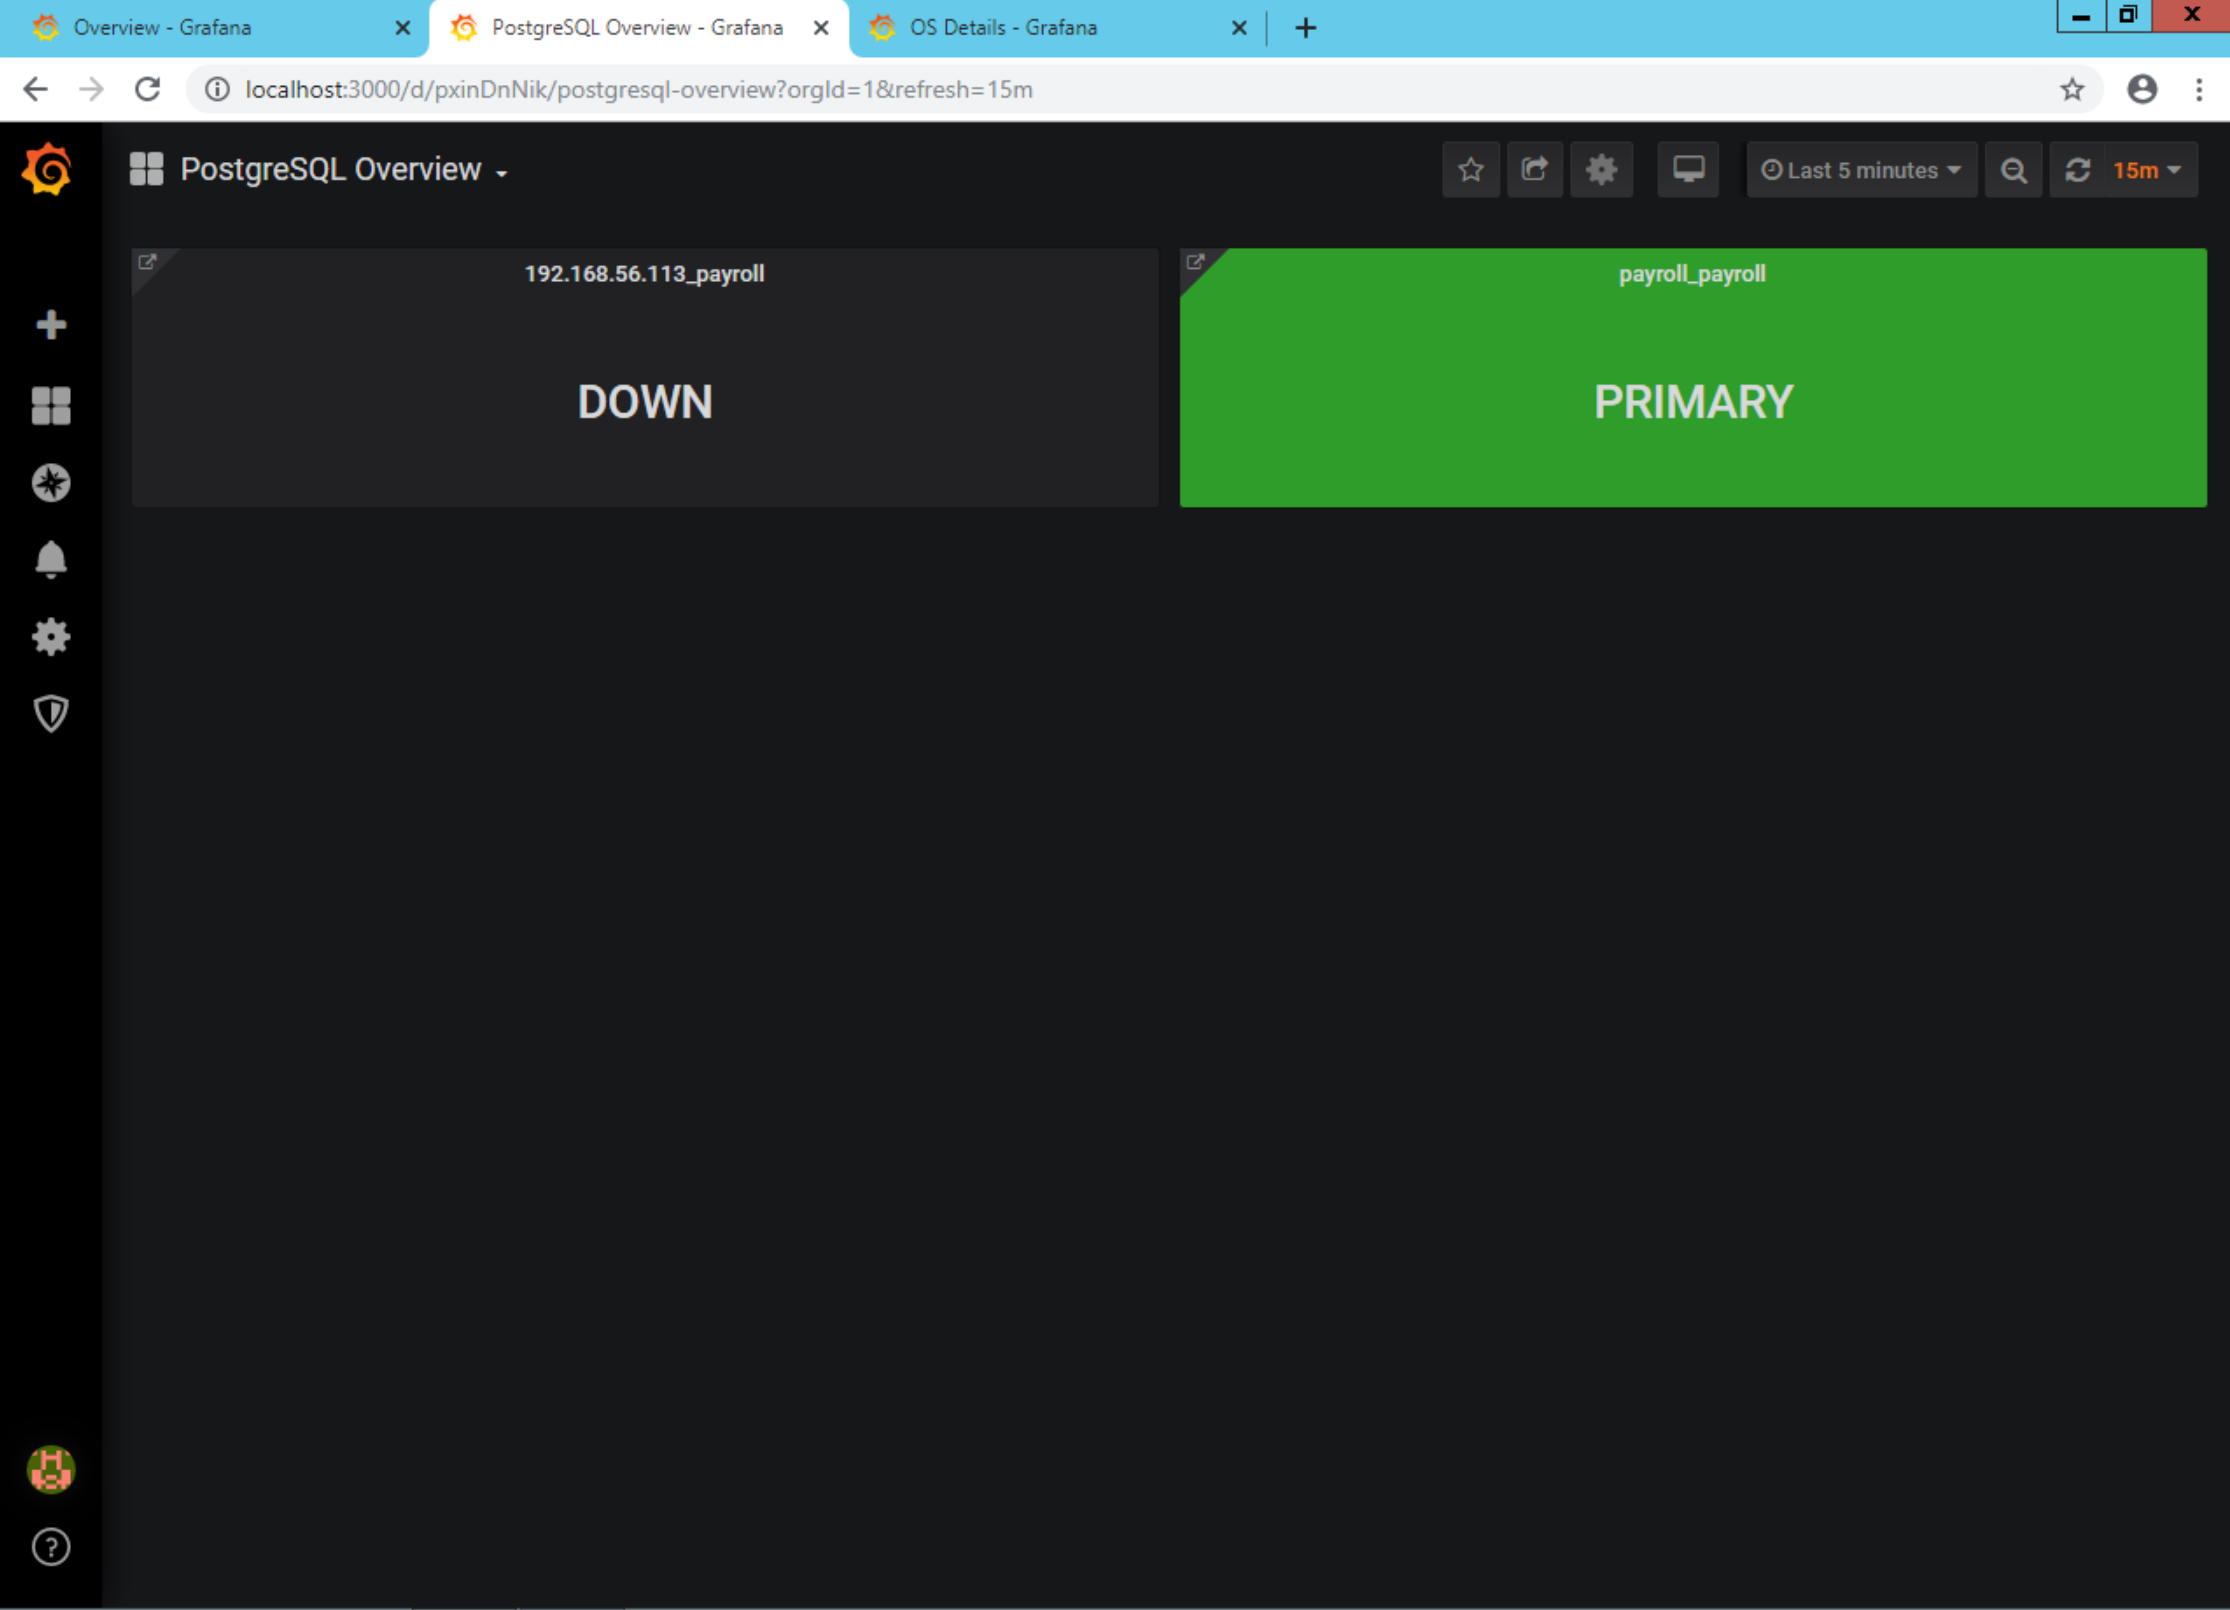
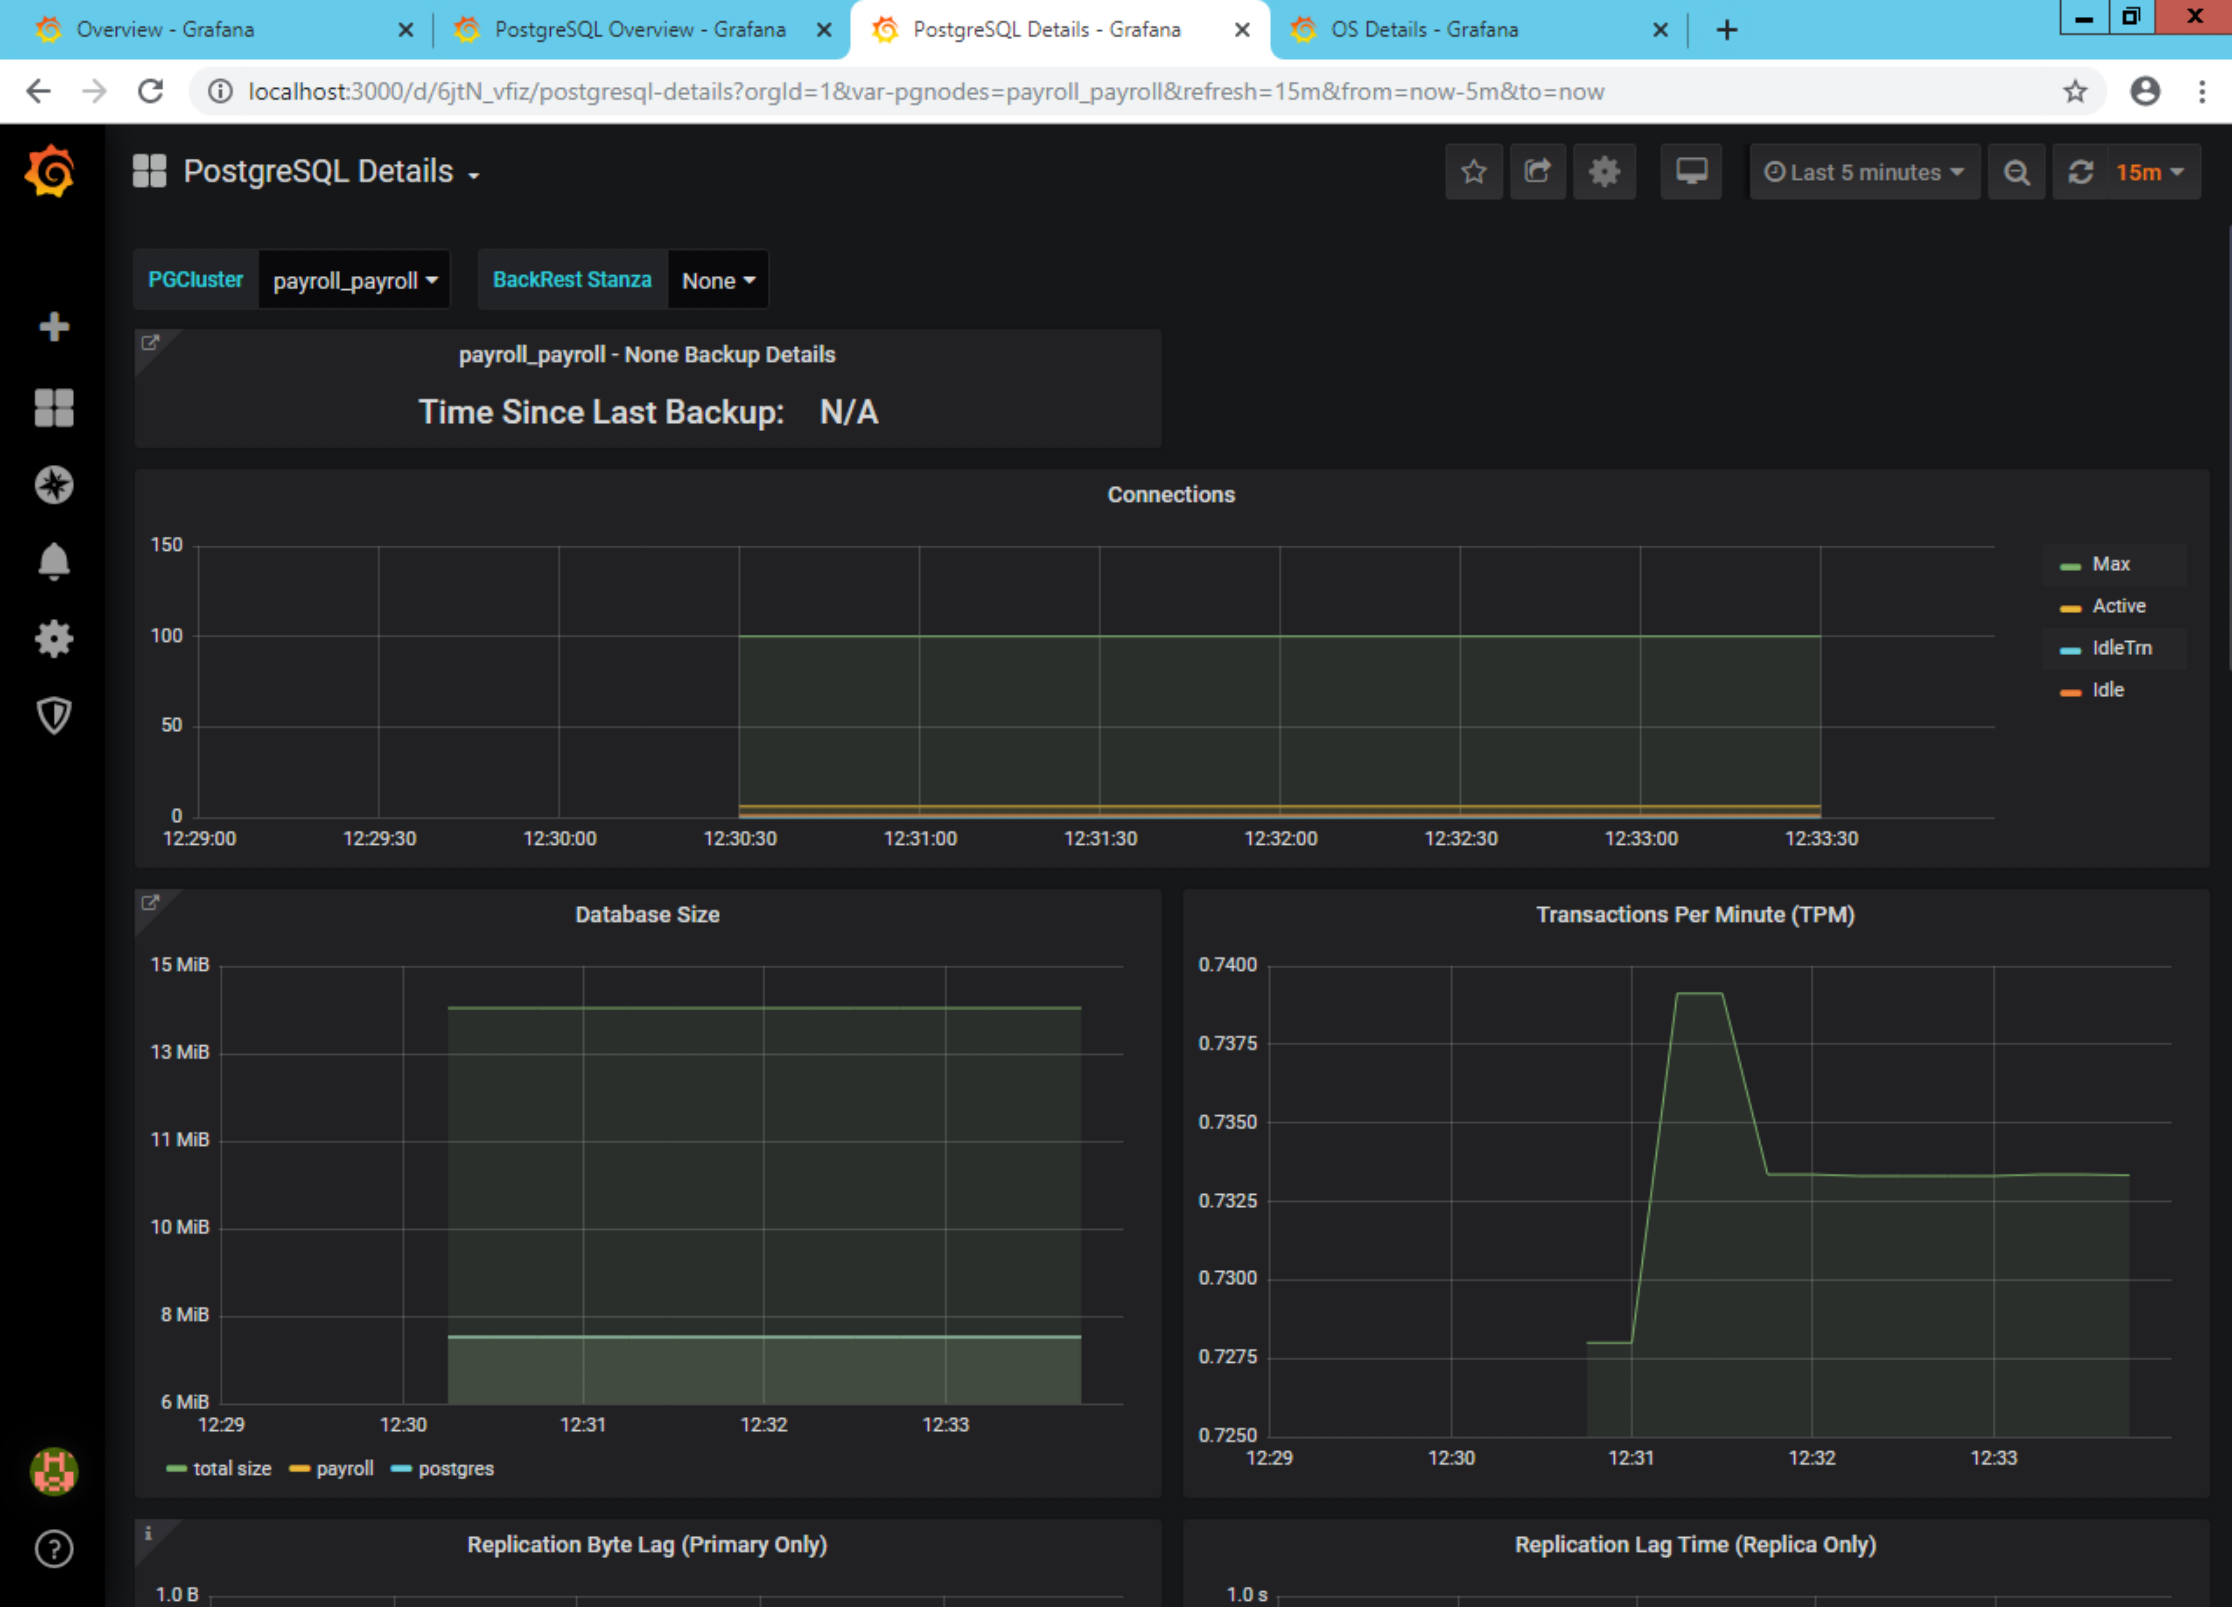
And finally, clicking any of the PostgreSQL hosts will take you to the ‘PostgreSQL Details’ dashboard for that PostgreSQL instance: