The Query tool - pgAdmin 4 1.3 documentation
The Query tool is a powerful, feature-rich environment that allows you to execute arbitrary SQL commands and review the result set. If you access the Query tool via the Query Tool menu option on the Tools menu, you can:
- Issue ad-hoc SQL queries.
- Execute arbitrary SQL commands.
- Save the data displayed in the output panel to a CSV file.
- Review the execution plan of a SQL statement in either a text or a graphical format.
- View analytical information about a SQL statement.
If you open the Query tool via the View Data context-menu, the Query tool acts as a data editor, allowing you to:
- View or modify the data that is stored in a table.
- Filter the result set.
- Save the data displayed in the output panel to a CSV file.
- Review the execution plan of a SQL statement in either a text or a graphical format.
- View analytical information about a SQL statement.
The Query tool features a toolbar that allows quick access to frequently used options, and a work environment divided into two panels:
- The upper panel of the Query tool contains the SQL Editor . You can use the panel to manually enter a query, or review the query that generated the result set displayed in the lower panel.
- The lower panel of the Query tool contains the Data Output panel. The output panel displays the result of a query, or information about a query’s execution plan.
pgAdmin allows you to open multiple copies of the Query tool (in individual tabs) simultaneously. For example, if you select Query tool from the Tools menu, the Query tool opens in a tab labeled Query-1 ; if you open the Query tool again (without closing Query-1 ), a second copy will open in Query-2 . To close a copy of the Query tool, click the X in the upper-right hand corner of the tab bar.
The Query tool Toolbar
The Query tool toolbar uses context-sensitive icons that provide shortcuts to frequently performed tasks. If an icon is highlighted, the option is enabled; if the icon is grayed-out, the task is disabled.

Hover over an icon to display a tooltip that describes the icon’s functionality:
| Icon | Behavior |
|---|---|
| Open File | Click the Open File icon to display a previously saved query in the SQL Editor. |
| Save | Click the Save icon to save the query that is currently displayed in the SQL Editor. |
| Copy | Click the Copy icon to copy the currently selected row. |
| Paste | Click the Paste icon to paste the content that is currently on the clipboard. |
| Add New Row | Use the Add New Row icon to add a new row in the output panel. |
| Filter |
Click the Filter icon to open a dialog that allows you to write and apply a filter for the content currently displayed in the output panel. Click the down arrow to open the Filter drop- down menu and select from pre-defined options:
|
| No limit | Use the No limit drop-down listbox to specify how many rows to display in the output panel. Select from: No limit (the default), 1000 rows , 500 rows , or 100 rows . |
| Execute/Refresh |
Click the Execute/Refresh icon to either execute or refresh the query highlighted in the SQL editor panel. Click the down arrow to access other execution options:
|
| Stop | Click the Stop icon to cancel the execution of the currently running query. |
| Clear query window | Use options on the Clear query window drop-down menu to erase the contents of the SQL editor panel or the History tab. |
| Download as CSV | Click the Download as CSV icon to download the result set of the current query to a comma-separated list. |
The SQL Editor Panel
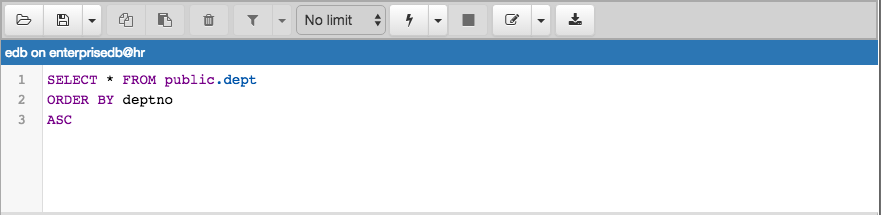
The SQL editor panel contains a workspace for entering commands; you can read a query from a file, or type a query. The SQL editor features syntax coloring and autocompletion to help you develop queries.
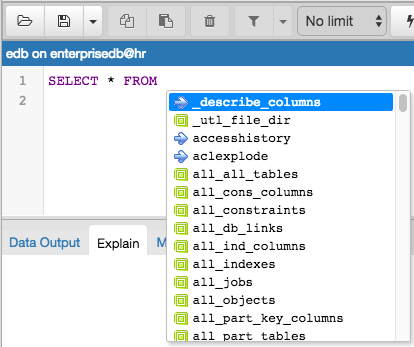
To use autocomplete, begin typing your query; when you would like the Query editor to suggest object names or commands that might be next in your query, press the Control+Space key combination. For example, type "*SELECT * FROM* " (without quotes, but with a trailing space), and then press the Control+Space key combination to select from a popup menu of autocomplete options.
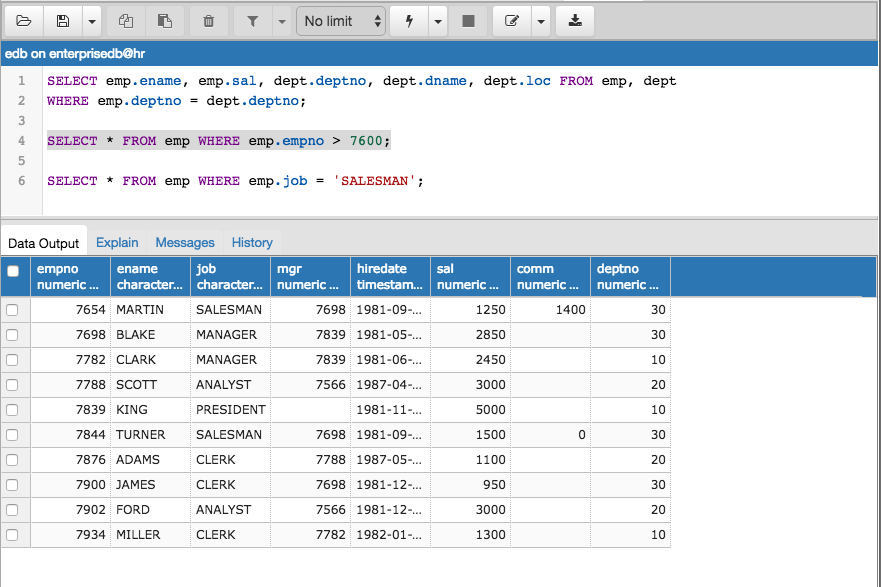
After entering a query, select the Execute/Refresh icon from the toolbar. The complete contents of the SQL editor panel will be sent to the database server for execution. To execute only a section of the code that is displayed in the SQL editor, highlight the text that you want the server to execute, and click the Execute/Refresh icon:
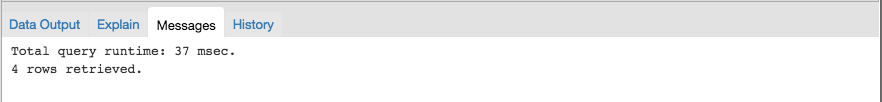
The message returned by the server when a command executes is displayed on the Messages tab of the output panel. If the command is successful, the Messages tab displays execution details:
The editor also offers several features that help with code formatting:
- The auto-indent feature will automatically indent text to the same depth as the previous line when you press the Return key.
- Block indent text by selecting two or more lines and pressing the Tab key.
The Data Output Panel
Use the Data Output panel of the Query tool to view data and information generated by a query in the SQL editor , or to View Data for an object currently selected in the pgAdmin tree control.
The Data Output panel organizes output through the following tabs: Data Output , Explain , Messages , and History .
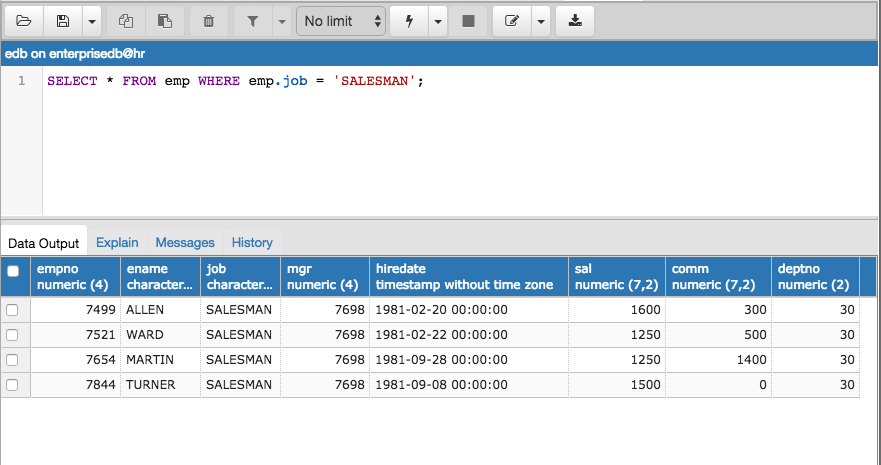
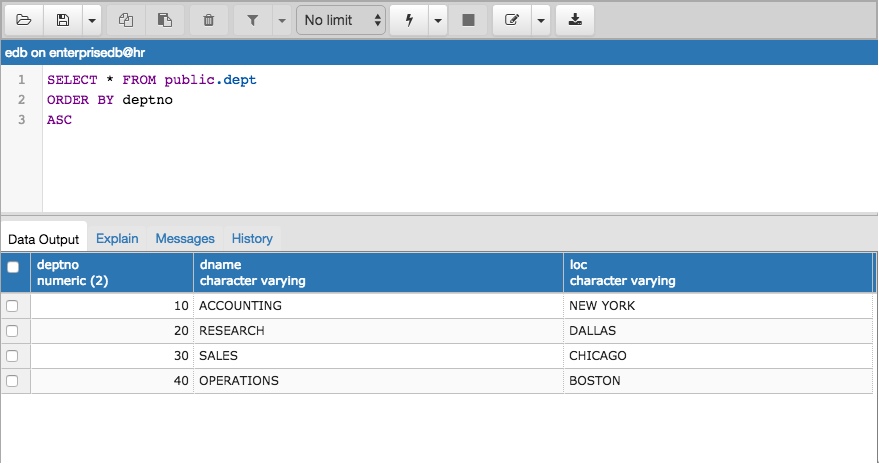
If the Query tool is opened through the Query tool menu option on the Tools menu, you can use the Data Output tab to view the results of an arbitrary query in a table format. If the Query tool is opened through a View Data context menu, the Data Output tab will display the data stored in the table from which the Query tool was opened.
- If enabled, use the Filter options from the Query tool toolbar to refine the result set displayed on the Data Output tab.
- If enabled, use the No limit drop-down to specify how many rows to display on the Data Output tab.
- If enabled, use the Execute/Refresh options to retrieve query execution information and set query execution options.
- Use the Download as CSV icon to download the content of the Data Output tab as a comma-delimited file.
All rowsets from previous queries or commands that are displayed in the Data Output panel will be discarded when you invoke another query; open another query tool browser tab to keep your previous results available.
If the Query Tool is opened using the View Data menu option and the data is updatable and has a primary key, then you can double-click on values on the Data Output tab and edit them:
- To enter a NULL, clear the value of the string.
- To enter a blank set the value of the cell to ‘’.
- To enter the string ‘’. enter the value ‘’.
Once the data has been edited as required, use the Save button to save the changes to the database.
Use the Explain tab to view a graphical representation of a query:
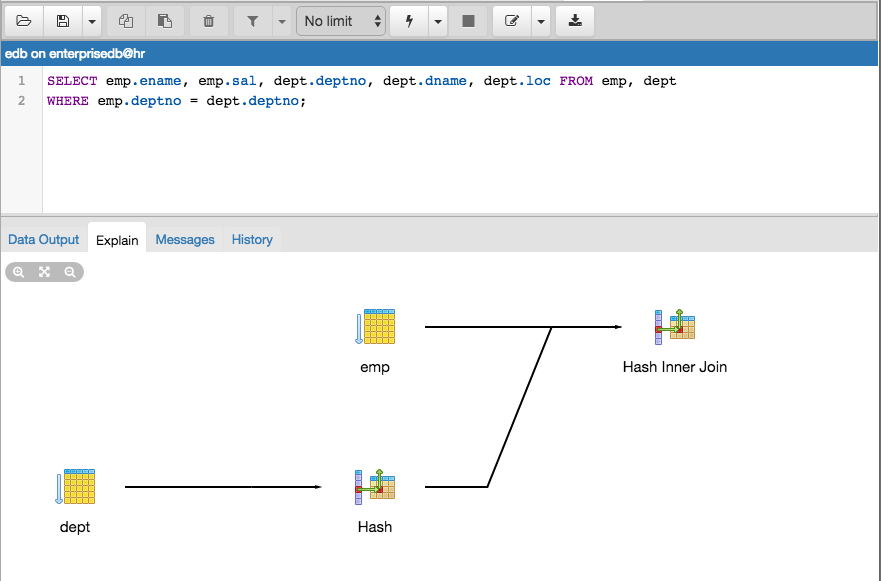
To generate a graphical explain diagram, open the Explain tab, and select Explain , Explain Analyze , or one or more options from the Explain options menu on the Execute/Refresh drop-down. Please note that EXPLAIN VERBOSE cannot be displayed graphically. Hover over an icon on the Explain tab to review information about that item; a popup window will display information about the selected object:
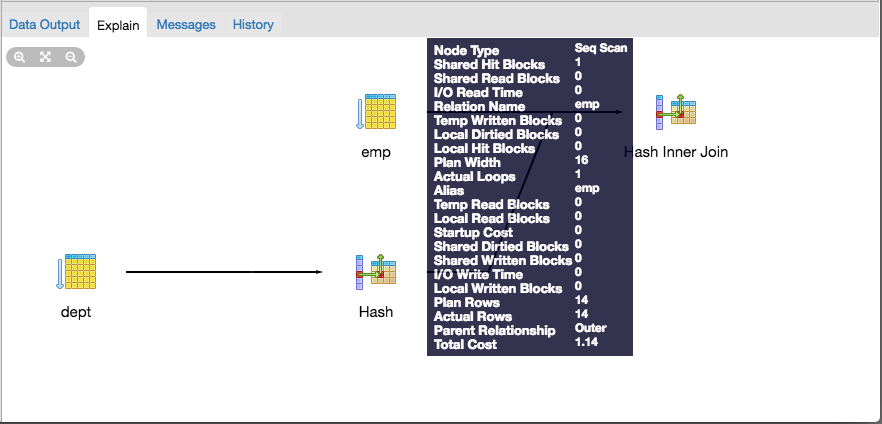
Note that the query plan that accompanies the Explain analyze is available on the Data Output tab.
Use the Messages tab to view information about the last-executed query:
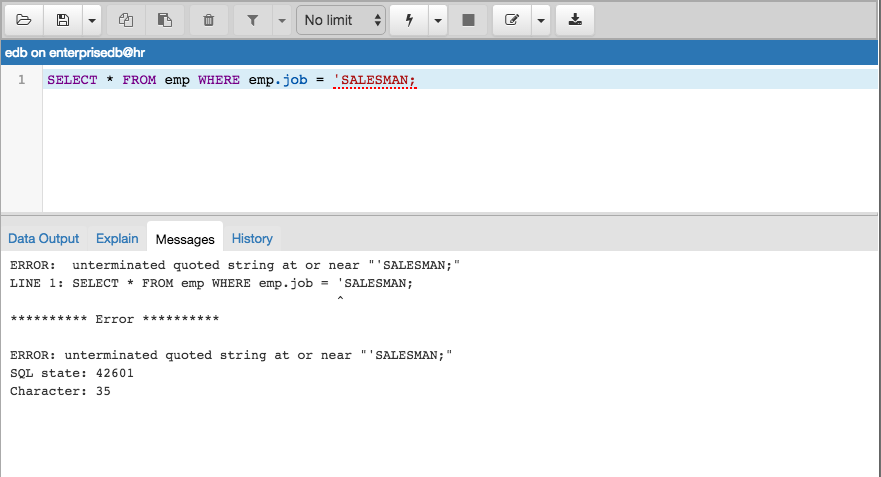
If the server returns an error, the error message will be displayed on the Messages tab, and the syntax that cause the error will be underlined in the SQL editor.
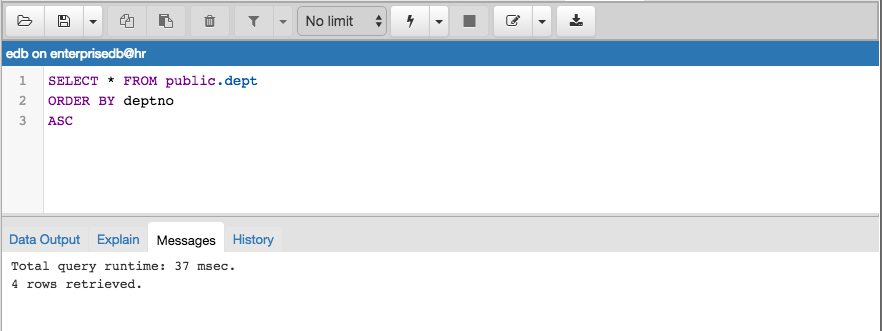
If a query succeeds, the Messages tab displays how long the query took to complete and how many rows were retrieved:
Use the History tab to review activity for the current session:
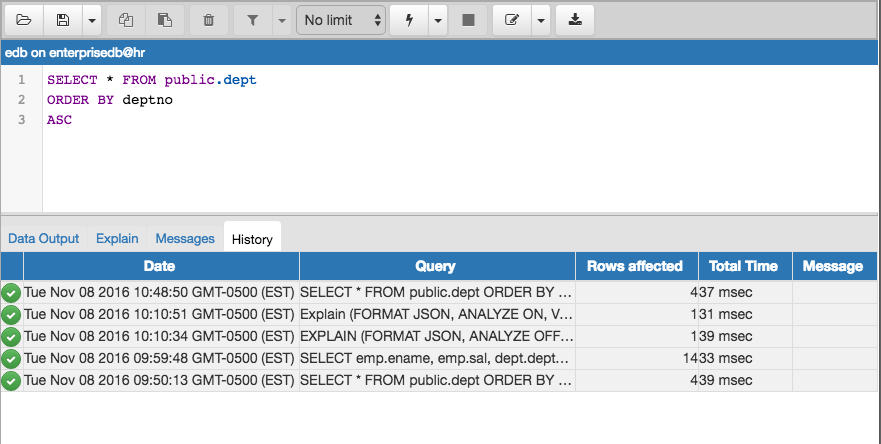
The History tab displays:
- The date and time that a query was invoked.
- The text of the query.
- The number of rows returned by the query.
- The amount of time it took the server to process the query and return a result set.
- Messages returned by the server (not noted on the Messages tab).
To erase the content of the History tab, select Clear history from the Clear query window drop-down menu.