pgMonitor

pgMonitor is your all-in-one tool to easily create an environment to visualize the health and performance of your PostgreSQL cluster.

pgMonitor combines a suite of tools to facilitate the collection and visualization of important metrics that you need be aware of in your PostgreSQL database and your host environment, including:
- Connection counts: how busy is your system being accessed and if connections are hanging
- Database size: how much disk your cluster is using
- Replication lag: know if your replicas are falling behind in loading data from your primary
- Transaction wraparound: don’t let your PostgreSQL database stop working
- Bloat: how much extra space are your tables and indexes using
- System metrics: CPU, Memory, I/O, uptime
pgMonitor is also highly configurable, and advanced users can design their own metrics, visualizations, and add in other features such as alerting.
Running pgMonitor will give you confidence in understanding how well your PostgreSQL cluster is performing, and will provide you the information to make calculated adjustments to your environment.
Contents
Purpose
pgMonitor is an open-source monitoring solution for PostgreSQL and the systems that it runs on. pgMonitor came from the need to provide a way to easily create a visual environment to monitor all the metrics a database administrator needs to proactively ensure the health of the system.
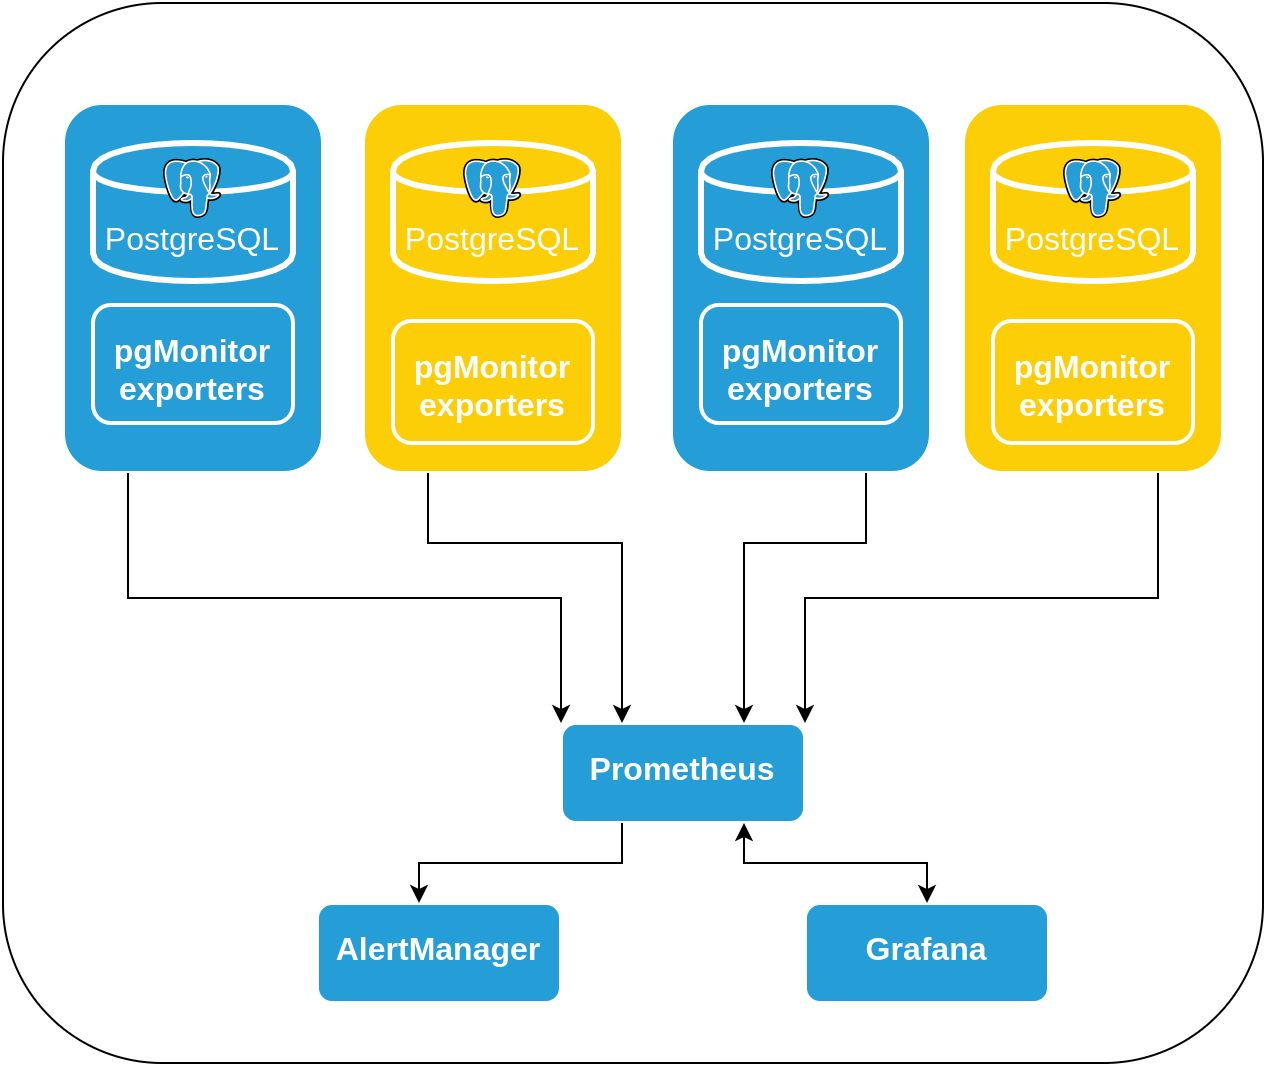
pgMonitor combines multiple open-source software packages and necessary configuration to create a robust PostgreSQL monitoring environment. These include:
- Prometheus - an open-source metrics collector that is highly customizable.
- Grafana - an open-source data visualizer that allows you to generate many different kinds of charts and graphs.
- PostgreSQL Exporter - an open-source data export to Prometheus that supports collecting metrics from any PostgreSQL server version 9.1 and above.

Supported Platforms
Operating Systems
- Prometheus/Alertmanager & Grafana: CentOS/RHEL 7 or greater, Windows Server 2012R2 or later
- Exporters (node, wmi, postgres):
- CentOS/RHEL 6 (node, Supported PG Versions up to 12)
- CentOS/RHEL 7 or greater (node, See Below for Supported PG Versions)
- Windows Server 2012R2 or later (wmi, See Below for Supported PG Versions)
PostgreSQL
- pgMonitor plans to support all PostgreSQL versions that are actively supported by the PostgreSQL community. Once a major version of PostgreSQL reaches its end-of-life (EOL), pgMonitor will cease supporting that major version soon after. Please see the official PostgreSQL website for community supported releases.
Known issues
- PostgreSQL 10+ SCRAM-SHA-256 encrypted passwords are supported on the Linux version of pgMonitor 4.0 or later only.
Installation
Installation instructions for each package are provided in that packages subfolder. Each step in the installation process is listed here, with a link to additional to further installation instructions for each package.
1. exporter
2. Prometheus
3. Grafana
Roadmap
- Additional monitoring metrics out-of-the-box
- Improved visualizations
- Project build testing
Version History
For the full history of pgMonitor, please see the CHANGELOG.
Sponsors
Crunchy Data is pleased to sponsor pgMonitor and many other open-source projects to help promote support the PostgreSQL community and software ecosystem.
Legal Notices
Copyright © 2017-2022 Crunchy Data Solutions, Inc. All Rights Reserved.
CRUNCHY DATA SOLUTIONS, INC. PROVIDES THIS GUIDE “AS IS” WITHOUT WARRANTY OF ANY KIND, EITHER EXPRESS OR IMPLIED, INCLUDING, BUT NOT LIMITED TO, THE IMPLIED WARRANTIES OF NON INFRINGEMENT, MERCHANTABILITY OR FITNESS FOR A PARTICULAR PURPOSE.
Crunchy, Crunchy Data Solutions, Inc. and the Crunchy Hippo Logo are trademarks of Crunchy Data Solutions, Inc. All Rights Reserved.
