withPoints - Family of functions - pgRouting Manual (3.8)
withPoints - Family of functions
When points are also given as input:
Warning
Proposed functions for next mayor release.
-
They are not officially in the current release.
-
They will likely officially be part of the next mayor release:
-
The functions make use of ANY-INTEGER and ANY-NUMERICAL
-
Name might not change. (But still can)
-
Signature might not change. (But still can)
-
Functionality might not change. (But still can)
-
pgTap tests have being done. But might need more.
-
Documentation might need refinement.
-
-
pgr_withPoints - Proposed - Route from/to points anywhere on the graph.
-
pgr_withPointsCost - Proposed - Costs of the shortest paths.
-
pgr_withPointsCostMatrix - proposed - Costs of the shortest paths.
-
pgr_withPointsKSP - Proposed - K shortest paths.
-
pgr_withPointsDD - Proposed - Driving distance.
-
pgr_withPointsVia - Proposed - Via routing
Introduction
This family of functions belongs to the withPoints - Category and the functions that compose them are based one way or another on dijkstra algorithm.
Depending on the name:
-
pgr_withPoints is pgr_dijkstra with points
-
pgr_withPointsCost is pgr_dijkstraCost with points
-
pgr_withPointsCostMatrix is pgr_dijkstraCostMatrix with points
-
pgr_withPointsKSP is pgr_ksp with points
-
pgr_withPointsDD is pgr_drivingDistance with points
-
pgr_withPointsvia is pgr_dijkstraVia with points
Parameters
|
Column |
Type |
Description |
|---|---|---|
|
|
Edges SQL as described below |
|
|
|
Points SQL as described below |
|
|
|
Combinations SQL as described below |
|
|
start vid |
|
Identifier of the starting vertex of the path. Negative value is for point’s identifier. |
|
start vids |
|
Array of identifiers of starting vertices. Negative values are for point’s identifiers. |
|
end vid |
|
Identifier of the ending vertex of the path. Negative value is for point’s identifier. |
|
end vids |
|
Array of identifiers of ending vertices. Negative values are for point’s identifiers. |
Optional parameters
|
Column |
Type |
Default |
Description |
|---|---|---|---|
|
|
|
|
|
With points optional parameters
|
Parameter |
Type |
Default |
Description |
|---|---|---|---|
|
|
|
|
Value in [
|
|
|
|
|
|
Inner Queries
Edges SQL
|
Column |
Type |
Default |
Description |
|---|---|---|---|
|
|
ANY-INTEGER |
Identifier of the edge. |
|
|
|
ANY-INTEGER |
Identifier of the first end point vertex of the edge. |
|
|
|
ANY-INTEGER |
Identifier of the second end point vertex of the edge. |
|
|
|
ANY-NUMERICAL |
Weight of the edge (
|
|
|
|
ANY-NUMERICAL |
-1 |
Weight of the edge (
|
Where:
- ANY-INTEGER :
-
SMALLINT,INTEGER,BIGINT - ANY-NUMERICAL :
-
SMALLINT,INTEGER,BIGINT,REAL,FLOAT
Points SQL
|
Parameter |
Type |
Default |
Description |
|---|---|---|---|
|
|
ANY-INTEGER |
value |
Identifier of the point.
|
|
|
ANY-INTEGER |
Identifier of the "closest" edge to the point. |
|
|
|
ANY-NUMERICAL |
Value in <0,1> that indicates the relative postition from the first end point of the edge. |
|
|
|
|
|
Value in [
|
Where:
- ANY-INTEGER :
-
SMALLINT,INTEGER,BIGINT - ANY-NUMERICAL :
-
SMALLINT,INTEGER,BIGINT,REAL,FLOAT
Combinations SQL
|
Parameter |
Type |
Description |
|---|---|---|
|
|
ANY-INTEGER |
Identifier of the departure vertex. |
|
|
ANY-INTEGER |
Identifier of the arrival vertex. |
Where:
- ANY-INTEGER :
-
SMALLINT,INTEGER,BIGINT
Advanced Documentation
Contents
About points
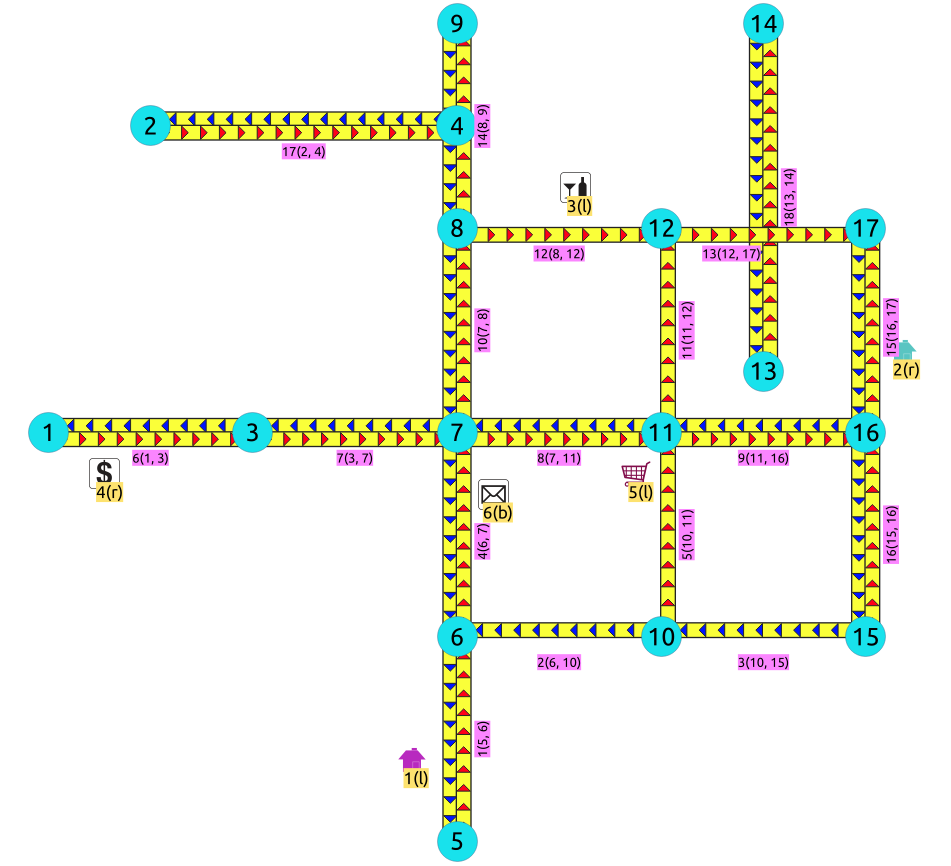
For this section the following city (see Sample Data ) some interesting points such as restaurant, supermarket, post office, etc. will be used as example.

-
The graph is directed
-
Red arrows show the
         (source,


         target)
of the edge on the edge table -
Blue arrows show the
         (target,


         source)
of the edge on the edge table -
Each point location shows where it is located with relation of the edge
(source, target)-
On the right for points 2 and 4 .
-
On the left for points 1 , 3 and 5 .
-
On both sides for point 6 .
-
The representation on the data base follows the Points SQL description, and for this example:
SELECT pid, edge_id, fraction, side FROM pointsOfInterest;
 pid  edge_id  fraction  side
-----+---------+----------+------
   1        1       0.4  l
   4        6       0.3  r
   3       12       0.6  l
   2       15       0.4  r
   5        5       0.8  l
   6        4       0.7  b
(6 rows)
Driving side
In the following images:
-
The squared vertices are the temporary vertices,
-
The temporary vertices are added according to the driving side,
-
visually showing the differences on how depending on the driving side the data is interpreted.
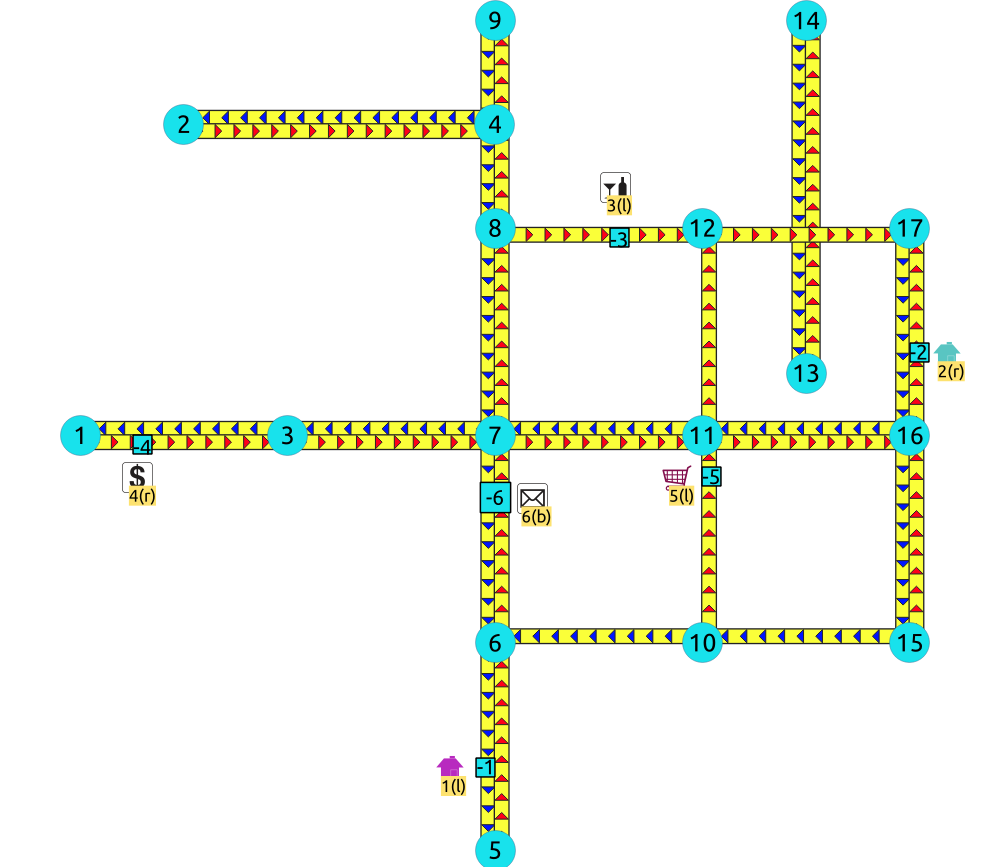
Right driving side

-
Point 1 located on edge
(6, 5) -
Point 2 located on edge
(16, 17) -
Point 3 located on edge
(8, 12) -
Point 4 located on edge
(1, 3) -
Point 5 located on edge
(10, 11) -
Point 6 located on edges
(6, 7)and(7, 6)
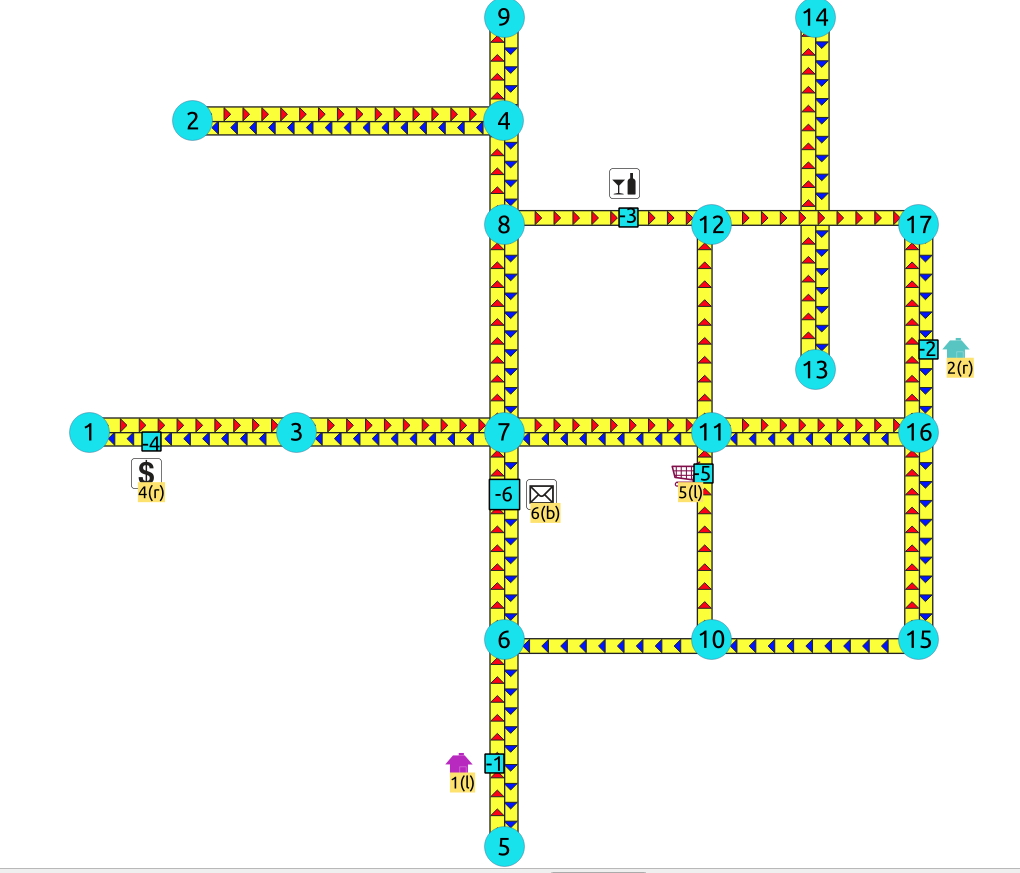
Left driving side

-
Point 1 located on edge
(5, 6) -
Point 2 located on edge
(17, 16) -
Point 3 located on edge
(8, 12) -
Point 4 located on edge
(3, 1) -
Point 5 located on edge
(10, 11) -
Point 6 located on edges
(6, 7)and(7, 6)
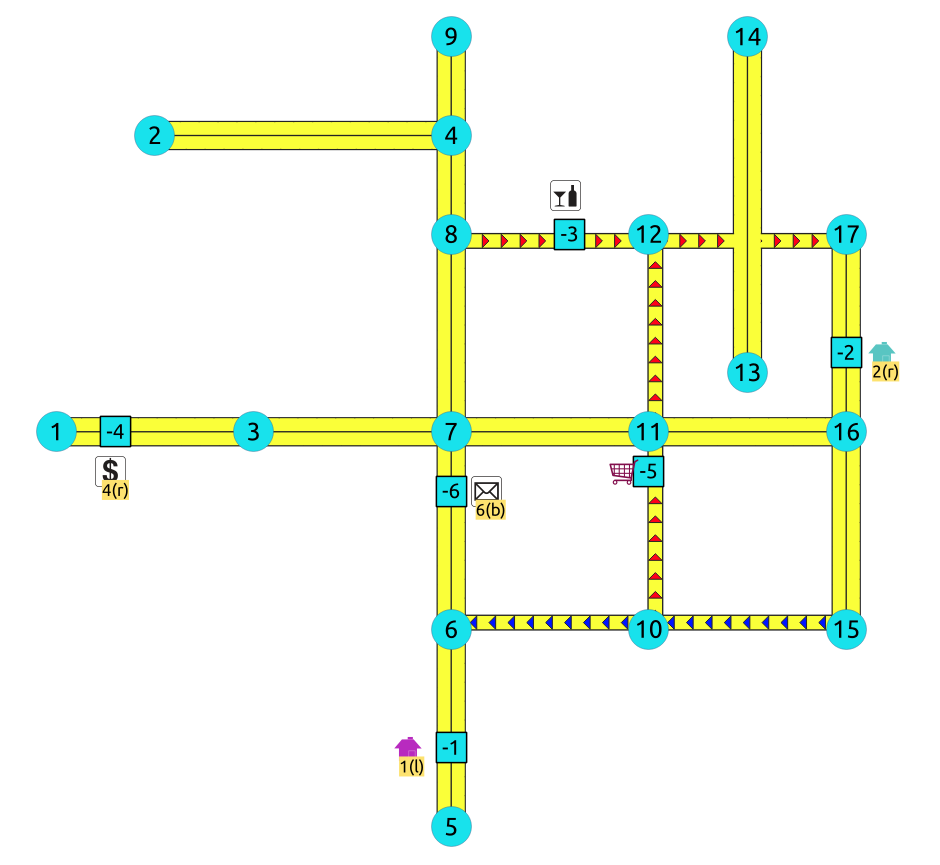
Driving side does not matter
-
Like having all points to be considered in both sides
b -
Preferred usage on undirected graphs
-
On the TRSP - Family of functions this option is not valid

-
Point 1 located on edge
(5, 6)and(6, 5) -
Point 2 located on edge
(17, 16)``and ``16, 17 -
Point 3 located on edge
(8, 12) -
Point 4 located on edge
(3, 1)and(1, 3) -
Point 5 located on edge
(10, 11) -
Point 6 located on edges
(6, 7)and(7, 6)
Creating temporary vertices
This section will demonstrate how a temporary vertex is created internally on the graph.
Problem
For edge:
SELECT id, source, target, cost, reverse_cost
FROM edges WHERE id = 15;
 id  source  target  cost  reverse_cost
----+--------+--------+------+--------------
 15      16      17     1             1
(1 row)
insert point:
SELECT pid, edge_id, fraction, side
FROM pointsOfInterest WHERE pid = 2;
 pid  edge_id  fraction  side
-----+---------+----------+------
   2       15       0.4  r
(1 row)
On a right hand side driving network
Right driving side

-
Arrival to point
-2can be achieved only via vertex 16 . -
Does not affects edge
          (17,


          16)
, therefore the edge is kept. -
It only affects the edge
          (16,


          17)
, therefore the edge is removed. -
Create two new edges:
-
Edge
            (16,


            -2)
with cost0.4(original cost * fraction == \(1 * 0.4\) ) -
Edge
            (-2,


            17)
with cost0.6(the remaining cost)
-
-
The total cost of the additional edges is equal to the original cost.
-
If more points are on the same edge, the process is repeated recursevly.
On a left hand side driving network
Left driving side

-
Arrival to point
-2can be achieved only via vertex 17 . -
Does not affects edge
          (16,


          17)
, therefore the edge is kept. -
It only affects the edge
          (17,


          16)
, therefore the edge is removed. -
Create two new edges:
-
Work with the original edge
            (16,


            17)
as the fraction is a fraction of the original:-
Edge
              (16,


              -2)
with cost0.4(original cost * fraction == \(1 * 0.4\) ) -
Edge
              (-2,


              17)
with cost0.6(the remaining cost) -
If more points are on the same edge, the process is repeated recursevly.
-
-
Flip the Edges and add them to the graph:
-
Edge
(17, -2)becomes(-2, 16)with cost0.4and is added to the graph. -
Edge
(-2, 16)becomes(17, -2)with cost0.6and is added to the graph.
-
-
-
The total cost of the additional edges is equal to the original cost.
When driving side does not matter

-
Arrival to point
-2can be achieved via vertices 16 or 17 . -
Affects the edges
(16, 17)and(17, 16), therefore the edges are removed. -
Create four new edges:
-
Work with the original edge
            (16,


            17)
as the fraction is a fraction of the original:-
Edge
              (16,


              -2)
with cost0.4(original cost * fraction == \(1 * 0.4\) ) -
Edge
              (-2,


              17)
with cost0.6(the remaining cost) -
If more points are on the same edge, the process is repeated recursevly.
-
-
Flip the Edges and add all the edges to the graph:
-
Edge
              (16,


              -2)
is added to the graph. -
Edge
              (-2,


              17)
is added to the graph. -
Edge
(16, -2)becomes(-2, 16)with cost0.4and is added to the graph. -
Edge
(-2, 17)becomes(17, -2)with cost0.6and is added to the graph.
-
-
See Also
Indices and tables