Monitoring

While having high availability, backups, and disaster recovery systems in place helps in the event of something going wrong with your PostgreSQL cluster, monitoring helps you anticipate problems before they happen. Additionally, monitoring can help you diagnose and resolve additional issues that may not result in downtime, but cause degraded performance.
There are many different ways to monitor systems within Kubernetes, including tools that come with Kubernetes itself. This is by no means to be a comprehensive on how to monitor everything in Kubernetes, but rather what the PostgreSQL Operator provides to give you an out-of-the-box monitoring solution.
Getting Started
If you want to install the metrics stack, please visit the installation instructions for the PostgreSQL Operator Monitoring stack.
Components
The PostgreSQL Operator Monitoring stack is made up of several open source components:
- pgMonitor, which provides the core
of the monitoring infrastructure including the following components:
- postgres_exporter, which provides queries used to collect metrics information about a PostgreSQL instance.
- Prometheus, a time-series database that scrapes and stores the collected metrics so they can be consumed by other services.
- Grafana, a visualization tool that provides charting and other capabilities for viewing the collected monitoring data.
- Alertmanager, a tool that can send alerts when metrics hit a certain threshold that require someone to intervene.
- pgnodemx, a PostgreSQL extension that is able to pull container-specific metrics (e.g. CPU utilization, memory consumption) from the container itself via SQL queries.
pgnodemx and the DownwardAPI
pgnodemx is able to pull and format container-specific metrics by accessing several
Kubernetes fields that are mounted from the pod to the database container’s filesystem.
By default, these fields include the pod’s labels and annotations, as well as the
database pod’s CPU and memory. These fields are mounted at the /etc/database-containerinfo
path.
Visualizations
Below is a brief description of all the visualizations provided by the PostgreSQL Operator Monitoring stack. Some of the descriptions may include some directional guidance on how to interpret the charts, though this is only to provide a starting point: actual causes and effects of issues can vary between systems.
Many of the visualizations can be broken down based on the following groupings:
- Cluster: which PostgreSQL cluster should be viewed
- Pod: the specific Pod or PostgreSQL instance
Overview
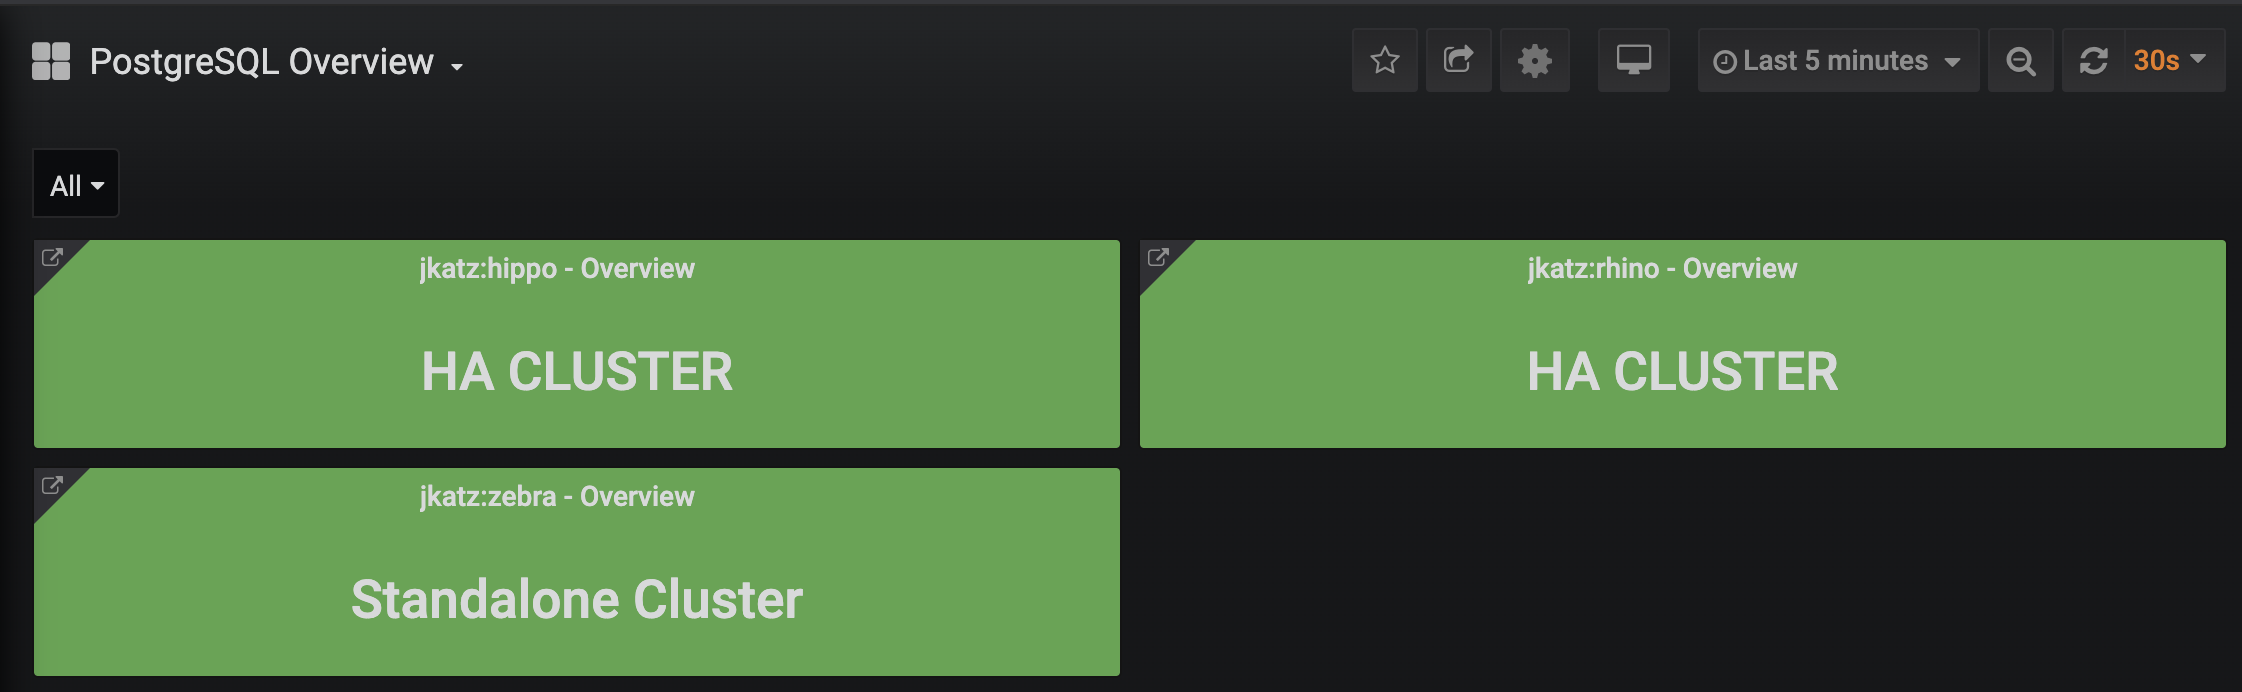
The overview provides an overview of all of the PostgreSQL clusters that are being monitoring by the PostgreSQL Operator Monitoring stack. This includes the following information:
- The name of the PostgreSQL cluster and the namespace that it is in
- The type of PostgreSQL cluster (HA [high availability] or standalone)
- The status of the cluster, as indicate by color. Green indicates the cluster is available, red indicates that it is not.
Each entry is clickable to provide additional cluster details.
PostgreSQL Details
The PostgreSQL Details view provides more information about a specific PostgreSQL cluster that is being managed and monitored by the PostgreSQL Operator. These include many key PostgreSQL-specific metrics that help make decisions around managing a PostgreSQL cluster. These include:
- Backup Status: The last time a backup was taken of the cluster. Green is good. Orange means that a backup has not been taken in more than a day and may warrant investigation.
- Active Connections: How many clients are connected to the database. Too many clients connected could impact performance and, for values approaching 100%, can lead to clients being unable to connect.
- Idle in Transaction: How many clients have a connection state of “idle in transaction”. Too many clients in this state can cause performance issues and, in certain cases, maintenance issues.
- Idle: How many clients are connected but are in an “idle” state.
- TPS: The number of “transactions per second” that are occurring. Usually needs to be combined with another metric to help with analysis. “Higher is better” when performing benchmarking.
- Connections: An aggregated view of active, idle, and idle in transaction connections.
- Database Size: How large databases are within a PostgreSQL cluster. Typically combined with another metric for analysis. Helps keep track of overall disk usage and if any triage steps need to occur around PVC size.
- WAL Size: How much space write-ahead logs (WAL) are taking up on disk. This
can contribute to extra space being used on your data disk, or can give you an
indication of how much space is being utilized on a separate WAL PVC. If you
are using replication slots, this can help indicate if a slot is not being
acknowledged if the numbers are much larger than the
max_wal_sizesetting (the PostgreSQL Operator does not use slots by default). - Row Activity: The number of rows that are selected, inserted, updated, and deleted. This can help you determine what percentage of your workload is read vs. write, and help make database tuning decisions based on that, in conjunction with other metrics.
- Replication Status: Provides guidance information on how much replication lag there is between primary and replica PostgreSQL instances, both in bytes and time. This can provide an indication of how much data could be lost in the event of a failover.
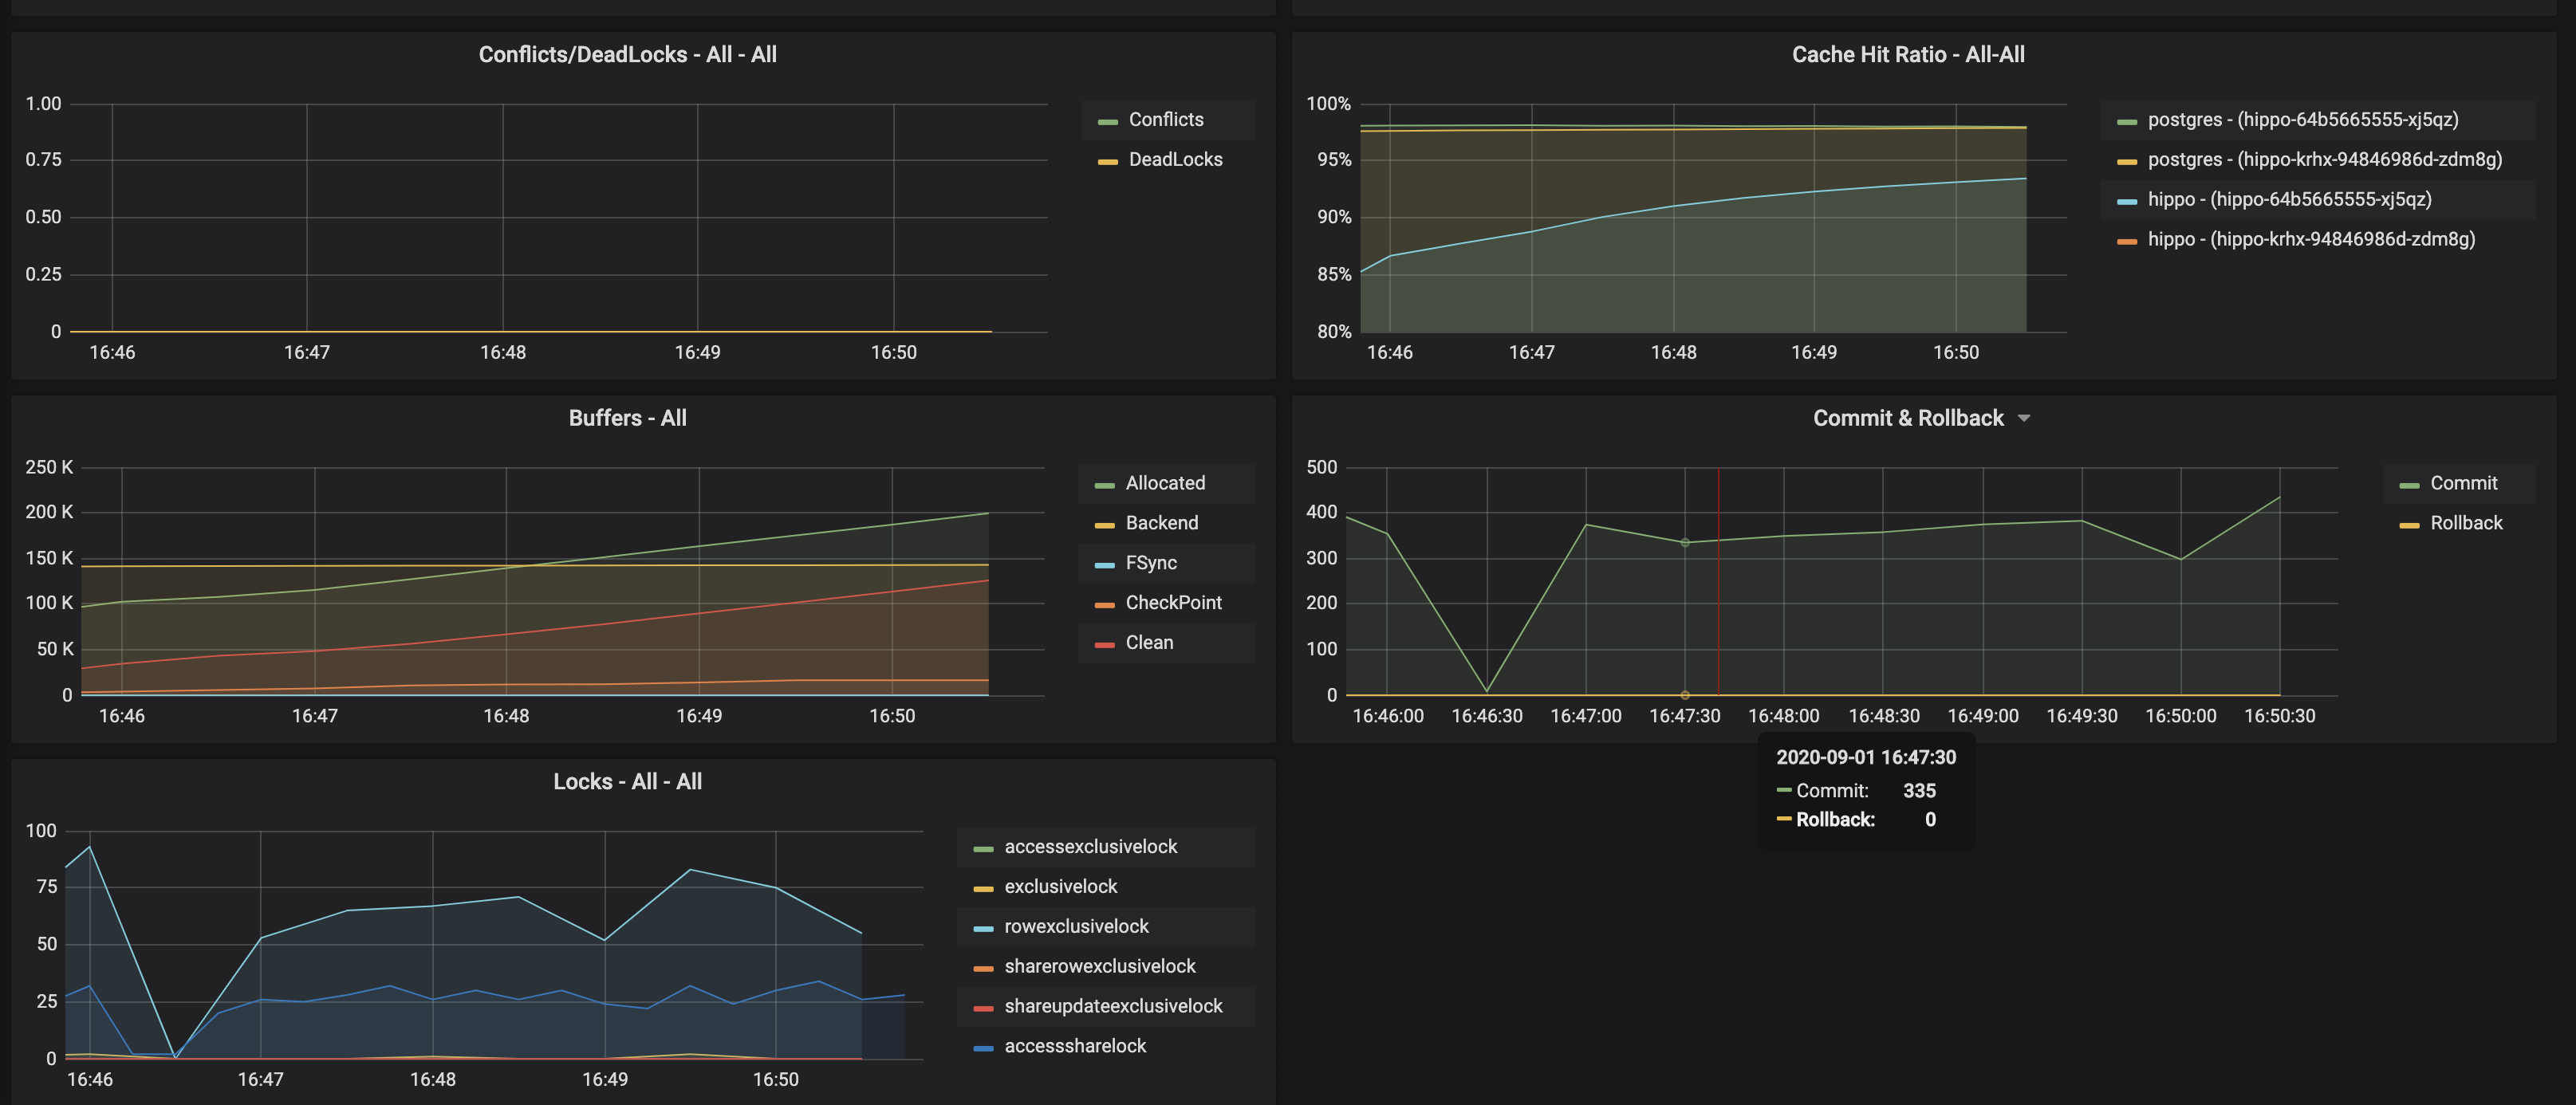
- Conflicts / Deadlocks: These occur when PostgreSQL is unable to complete
operations, which can result in transaction loss. The goal is for these numbers
to be
0. If these are occurring, check your data access and writing patterns. - Cache Hit Ratio: A measure of how much of the “working data”, e.g. data that is being accessed and manipulated, resides in memory. This is used to understand how much PostgreSQL is having to utilize the disk. The target number of this should be as high as possible. How to achieve this is the subject of books, but certain takes efforts on your applications use PostgreSQL.
- Buffers: The buffer usage of various parts of the PostgreSQL system. This can be used to help understand the overall throughput between various parts of the system.
- Commit & Rollback: How many transactions are committed and rolled back.
- Locks: The number of locks that are present on a given system.
Pod Details

Pod details provide information about a given Pod or Pods that are being used by a PostgreSQL cluster. These are similar to “operating system” or “node” metrics, with the differences that these are looking at resource utilization by a container, not the entire node.
It may be helpful to view these metrics on a “pod” basis, by using the Pod filter at the top of the dashboard.
- Disk Usage: How much space is being consumed by a volume.
- Disk Activity: How many reads and writes are occurring on a volume.
- Memory: Various information about memory utilization, including the request and limit as well as actually utilization.
- CPU: The amount of CPU being utilized by a Pod
- Network Traffic: The amount of networking traffic passing through each network device.
- Container Resources: The CPU and memory limits and requests.
Backups

There are a variety of reasons why you need to monitoring your backups, starting from answering the fundamental question of “do I have backups available?” Backups can be used for a variety of situations, from cloning new clusters to restoring clusters after a disaster. Additionally, Postgres can run into issues if your backup repository is not healthy, e.g. if it cannot push WAL archives. If your backups are set up properly and healthy, you will be set up to mitigate the risk of data loss!
The backup, or pgBackRest panel, will provide information about the overall state of your backups. This includes:
- Recovery Window: This is an indicator of how far back you are able to restore your data from. This represents all of the backups and archives available in your backup repository. Typically, your recovery window should be close to your overall data retention specifications.
- Time Since Last Backup: this indicates how long it has been since your last backup. This is broken down into pgBackRest backup type (full, incremental, differential) as well as time since the last WAL archive was pushed.
- Backup Runtimes: How long the last backup of a given type (full, incremental differential) took to execute. If your backups are slow, consider providing more resources to the backup jobs and tweaking pgBackRest’s performance tuning settings.
- Backup Size: How large the backups of a given type (full, incremental, differential).
- WAL Stats: Shows the metrics around WAL archive pushes. If you have failing pushes, you should to see if there is a transient or permanent error that is preventing WAL archives from being pushed. If left untreated, this could end up causing issues for your Postgres cluster.
PostgreSQL Service Health Overview
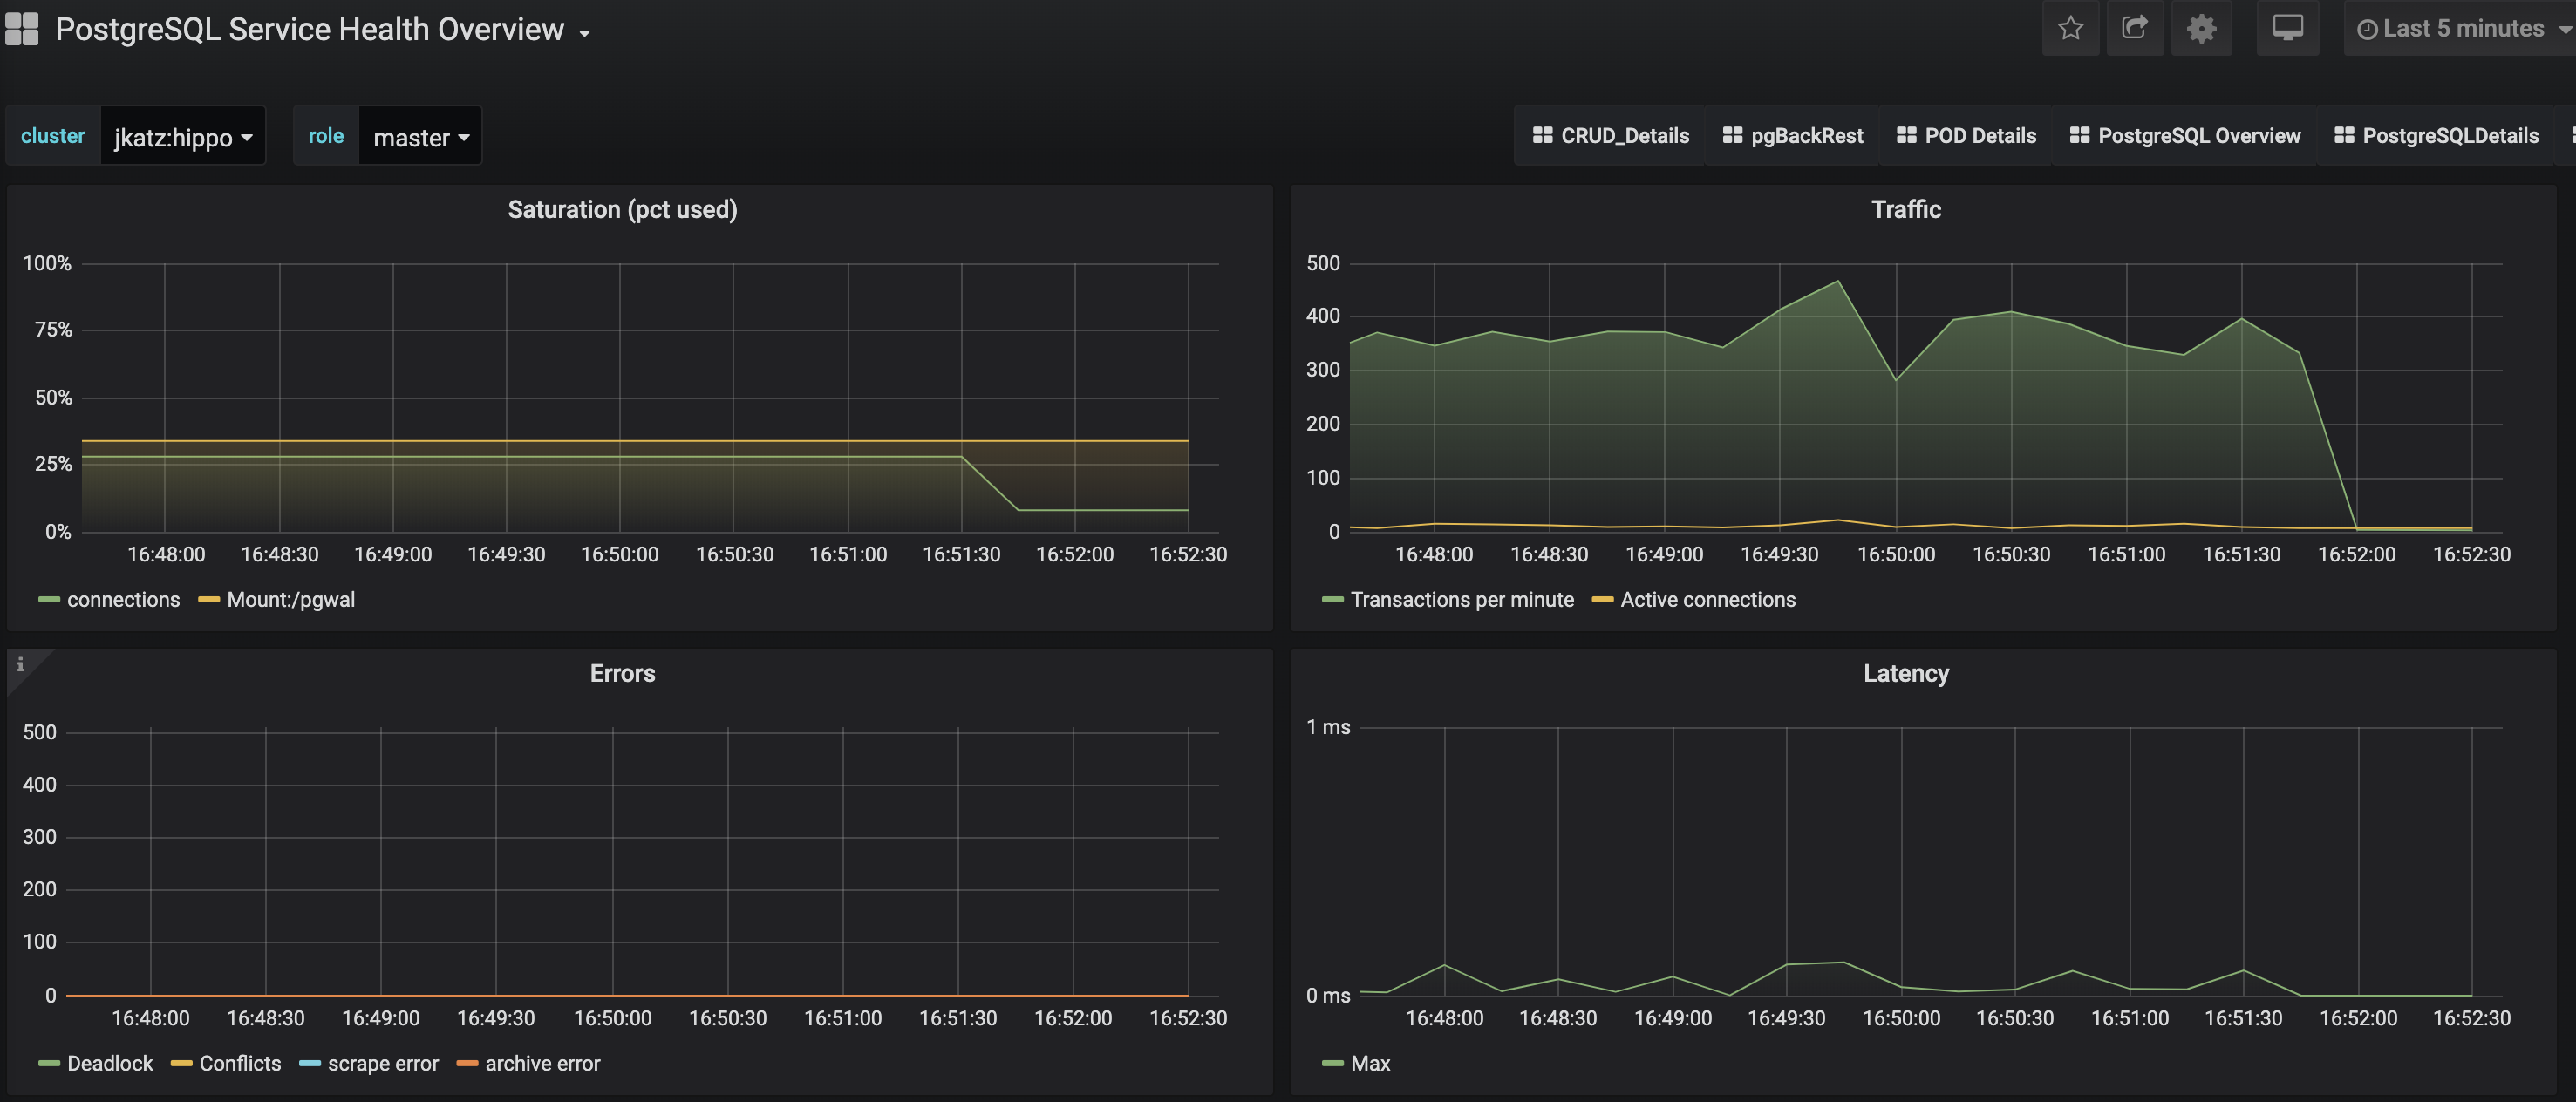
The Service Health Overview provides information about the Kubernetes Services that sit in front of the PostgreSQL Pods. This provides information about the status of the network.
- Saturation: How much of the available network to the Service is being consumed. High saturation may cause degraded performance to clients or create an inability to connect to the PostgreSQL cluster.
- Traffic: Displays the number of transactions per minute that the Service is handling.
- Errors: Displays the total number of errors occurring at a particular Service.
- Latency: What the overall network latency is when interfacing with the Service.
Query Runtime
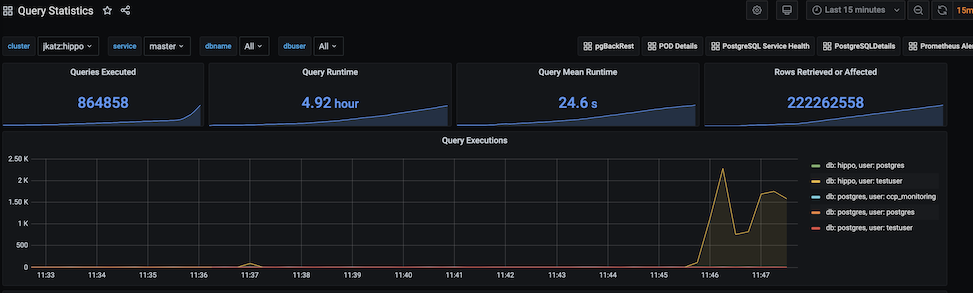
Looking at the overall performance of queries can help optimize a Postgres deployment, both from providing resources to query tuning in the application itself.
You can get a sense of the overall activity of a PostgreSQL cluster from the chart that is visualized above:
- Queries Executed: The total number of queries executed on a system during the period.
- Query runtime: The aggregate runtime of all the queries combined across the system that were executed in the period.
- Query mean runtime: The average query time across all queries executed on the system in the given period.
- Rows retrieved or affected: The total number of rows in a database that were either retrieved or had modifications made to them.
PostgreSQL Operator Monitoring also further breaks down the queries so you can identify queries that are being executed too frequently or are taking up too much time.
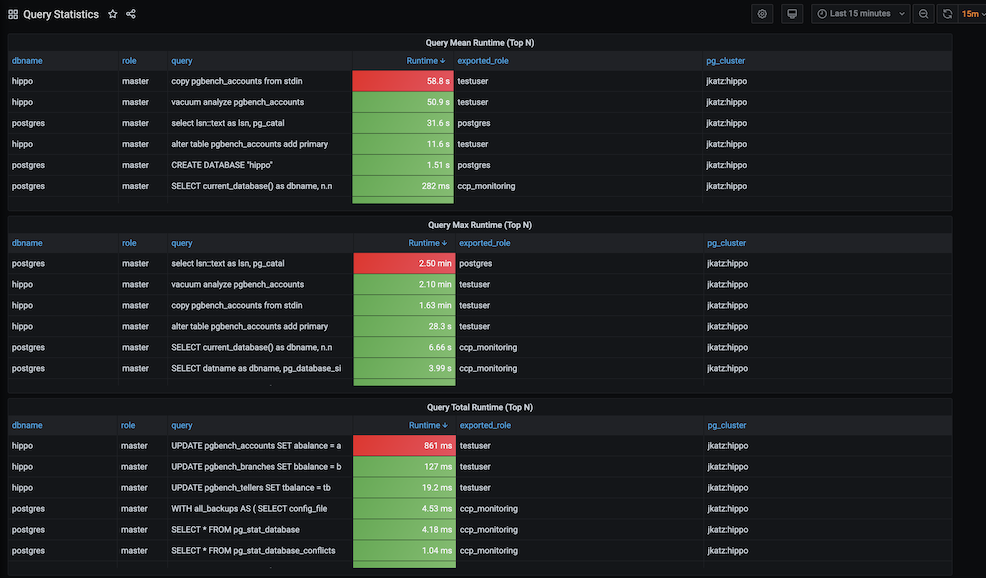
- Query Mean Runtime (Top N): This highlights the N number of slowest queries by average runtime on the system. This might indicate you are missing an index somewhere, or perhaps the query could be rewritten to be more efficient.
- Query Max Runtime (Top N): This highlights the N number of slowest queries by absolute runtime. This could indicate that a specific query or the system as a whole may need more resources.
- Query Total Runtime (Top N): This highlights the N of slowest queries by aggregate runtime. This could indicate that a ORM is looping over a single query and executing it many times that could possibly be rewritten as a single, faster query.
Alerts
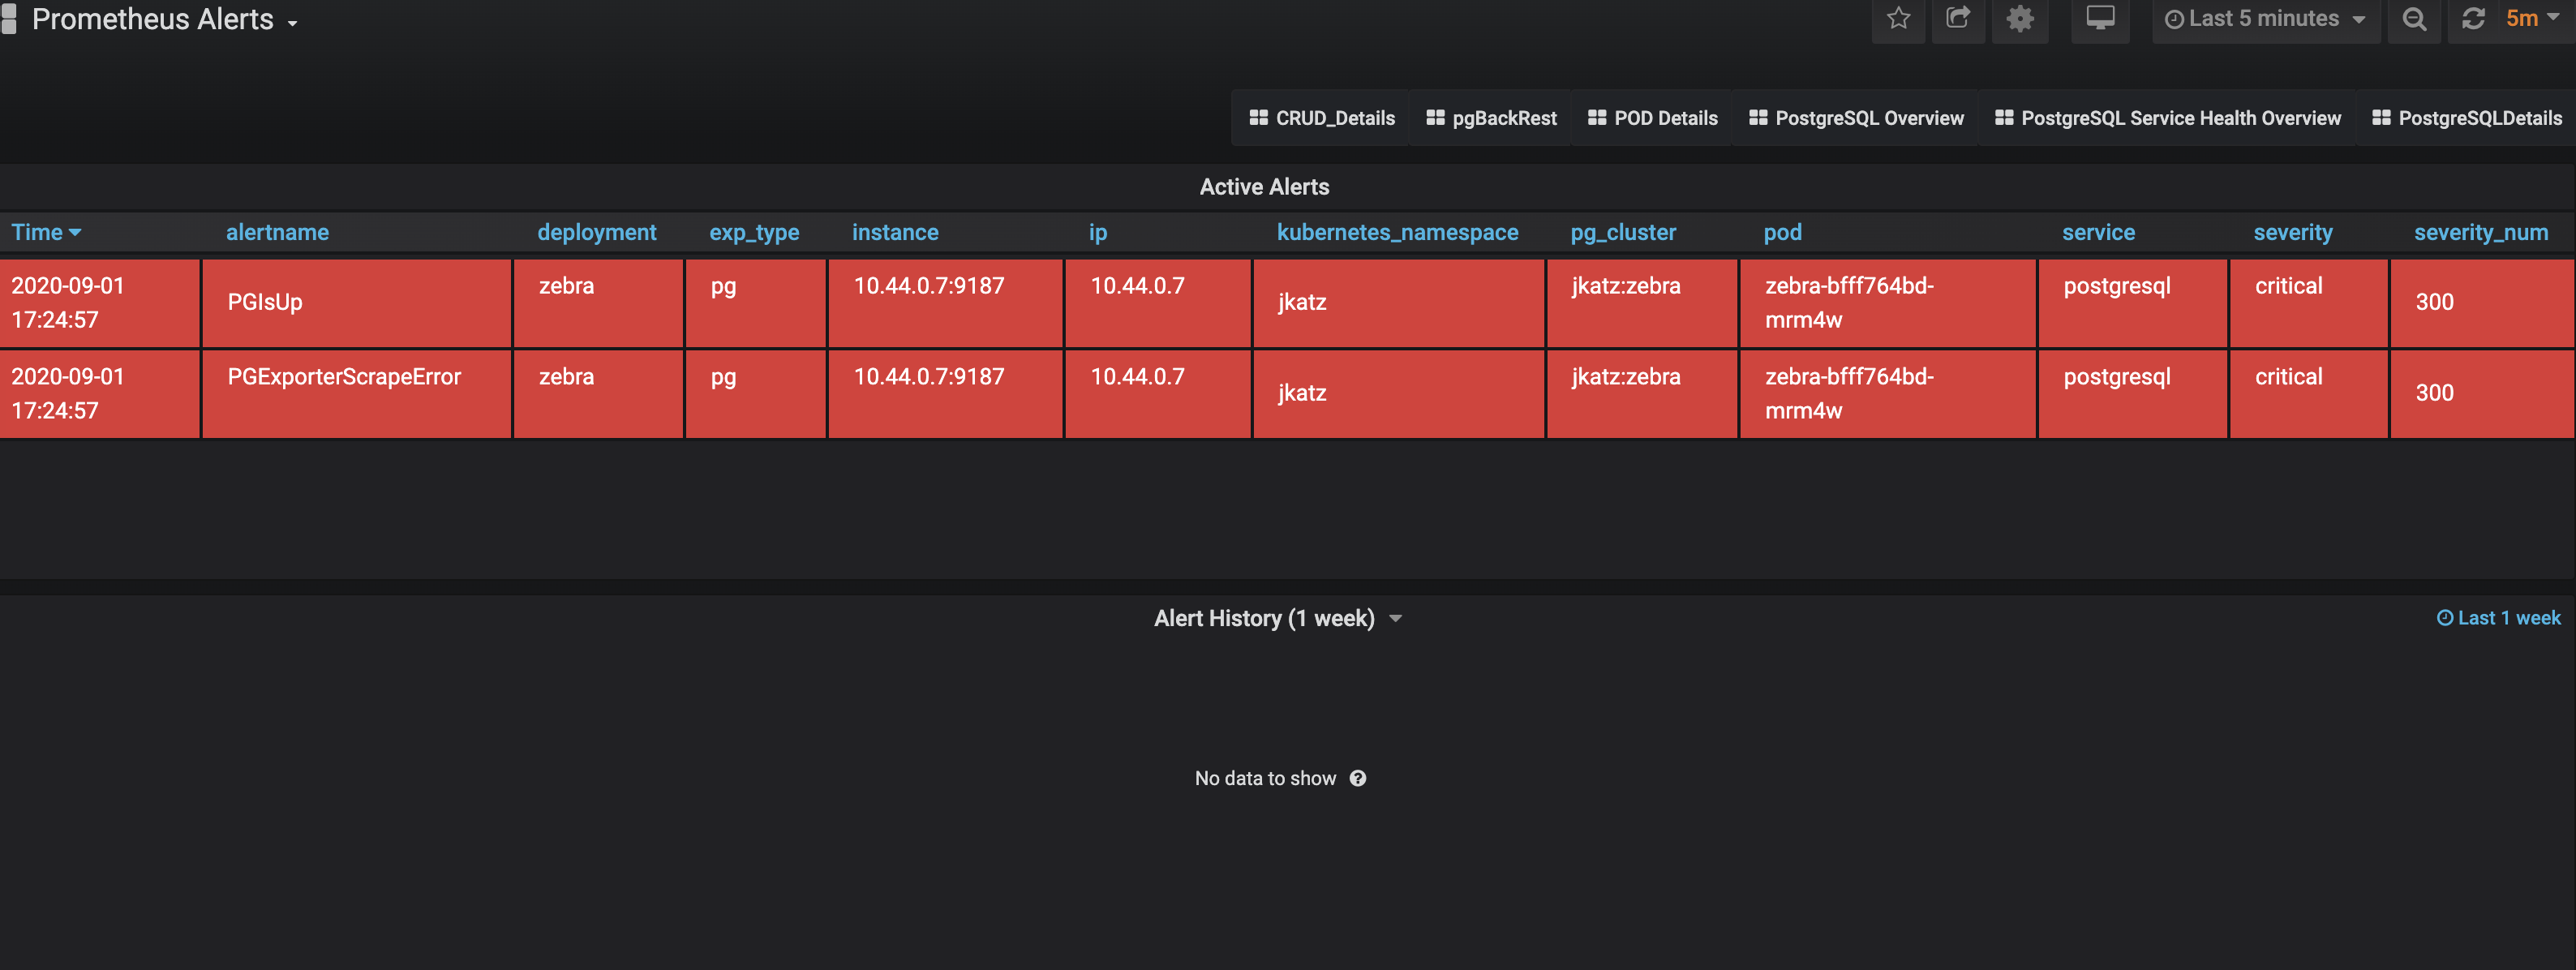
Alerting lets one view and receive alerts about actions that require intervention, for example, a HA cluster that cannot self-heal. The alerting system is powered by Alertmanager.
The alerts that come installed by default include:
PGExporterScrapeError: The Crunchy PostgreSQL Exporter is having issues scraping statistics used as part of the monitoring stack.PGIsUp: A PostgreSQL instance is down.PGIdleTxn: There are too many connections that are in the “idle in transaction” state.PGQueryTime: A single PostgreSQL query is taking too long to run. Issues a warning at 12 hours and goes critical after 24.PGConnPerc: Indicates that there are too many connection slots being used. Issues a warning at 75% and goes critical above 90%.PGDiskSize: Indicates that a PostgreSQL database is too large and could be in danger of running out of disk space. Issues a warning at 75% and goes critical at 90%.PGReplicationByteLag: Indicates that a replica is too far behind a primary instance, which could risk data loss in a failover scenario. Issues a warning at 50MB an goes critical at 100MB.PGReplicationSlotsInactive: Indicates that a replication slot is inactive. Not attending to this can lead to out-of-disk errors.PGXIDWraparound: Indicates that a PostgreSQL instance is nearing transaction ID wraparound. Issues a warning at 50% and goes critical at 75%. It’s important that you vacuum your database to prevent this.PGEmergencyVacuum: Indicates that autovacuum is not running or cannot keep up with ongoing changes, i.e. it’s past its “freeze” age. Issues a warning at 110% and goes critical at 125%.PGArchiveCommandStatus: Indicates that the archive command, which is used to ship WAL archives to pgBackRest, is failing.PGSequenceExhaustion: Indicates that a sequence is over 75% used.PGSettingsPendingRestart: Indicates that there are settings changed on a PostgreSQL instance that requires a restart.
Optional alerts that can be enabled:
PGMinimumVersion: Indicates if PostgreSQL is below a desired version.PGRecoveryStatusSwitch_Replica: Indicates that a replica has been promoted to a primary.PGConnectionAbsent_Prod: Indicates that metrics collection is absent from a PostgresQL instance.PGSettingsChecksum: Indicates that PostgreSQL settings have changed from a previous state.PGDataChecksum: Indicates that there are data checksum failures on a PostgreSQL instance. This could be a sign of data corruption.
You can modify these alerts as you see fit, and add your own alerts as well! Please see the installation instructions for general setup of the PostgreSQL Operator Monitoring stack.