Setting up Prometheus
Prometheus can be set up on any Linux-based system, but pgMonitor currently only supports running it on RHEL/CentOS 7. Crunchy Data additionally makes Prometheus available on Windows Server 2012R2 for their customers.
Installation
RHEL / CentOS 7
With RPM Packages
There are RPM packages available to Crunchy Data customers through the Crunchy Customer Portal.
After installing via these RPMs, you can continue reading at the Setup section.
Available Packages
| Package Name | Description |
|---|---|
| alertmanager | Base package for the Alertmanager |
| prometheus2 | Base package for Prometheus 2.x |
| pgmonitor-alertmanager-extras | Custom Crunchy configurations for Alertmanager |
| pgmonitor-prometheus-extras | Custom Crunchy configurations for Prometheus |
Without Crunchy Data Packages
For installations without using packages provided by Crunchy Data, we recommend using the repository maintained at https://github.com/lest/prometheus-rpm. Instructions for setup and installation are contained there. Note this only sets up the base service. The additional files and steps for pgMonitor still need to be set up as instructed below.
Or you can also download Prometheus and Alertmanager from the original site at https://prometheus.io/download. Note that no base service setup is provided here, just the binaries.
Minimum Versions
pgMonitor assumes to be using at least Prometheus 2.9.x. We recommend to always use the latest minor version of Prometheus.
User and Configuration Directory Installation
You will need to create a system user named ccp_monitoring which you can do with the following command:
sudo useradd -d /var/lib/ccp_monitoring ccp_monitoringConfiguration File Installation
The files contained in this repository are assumed to be installed in the following locations with the following names:
Prometheus
The Prometheus data directory should be /var/lib/ccp_monitoring/prometheus and owned by the ccp_monitoring user. You can set it up with:
sudo install -d -m 0700 -u ccp_monitoring -g ccp_monitoring /var/lib/ccp_monitoring/prometheusThe following pgmonitor configuration files should be placed according to the following mapping:
| pgMonitor Configuration File | System Location |
|---|---|
| crunchy-prometheus-service-el7.conf | /etc/systemd/system/prometheus.service.d/crunchy-prometheus-service-el7.conf |
| sysconfig.prometheus | /etc/sysconfig/prometheus |
| crunchy-prometheus.yml | /etc/prometheus/crunchy-prometheus.yml |
| auto.d/*.yml.example | /etc/prometheus/auto.d/*.yml.example |
| crunchy-alertmanager.yml | /etc/prometheus/crunchy-alertmanager.yml |
| alert-rules.d/crunchy-alert-rules*.yml.example | /etc/prometheus/alert-rules.d/crunchy-alert-rules-\*.yml.example |
Alertmanager
The Alertmanager data directory should be /var/lib/ccp_monitoring/alertmanager and owned by the ccp_monitoring user. You can set it up with:
sudo install -d -m 0700 -o ccp_monitoring -g ccp_monitoring /var/lib/ccp_monitoring/alertmanagerThe following pgMonitor configuration files should be placed according to the following mapping:
| pgMonitor Configuration File | System Location |
|---|---|
| crunchy-alertmanager-service-el7.conf | /etc/systemd/system/alertmanager.service.d/crunchy-alertmanager-service-el7.conf |
| sysconfig.alertmanager | /etc/sysconfig/alertmanager |
Windows Server 2012R2
There are Windows Servfer 2012R2 packages available to Crunchy Data customers who contact Crunchy Data directly.
If you install the below available packages, you can continue reading at the Setup section.
Available Packages
| Package Name | Description |
|---|---|
| pgMonitor_server_1.0_Crunchy.win.x86_64.exe | Installer package for the Prometheus, Alertmanager, and Grafana servers |
Upgrading
When upgrading from pgmonitor 1.x to 2.x, note that the alerting rules for node_exporter metrics have had many of their names changed. If you’ve changed the provided alerting rules file, installing the new package should create a file called /etc/prometheus/crunchy-alert-rules.yml.rpmnew and not overwrite your current file. You should be able to copy the new rules as needed from there.
Setup
Setup on RHEL/CentOS 7
Service Configuration
The following files contain defaults that should enable Prometheus and Alertmanager to run effectively on your system for the purposes of using pgmonitor. You should take some time to review them.
If you need to modify them, see the notes in the files for more details and recommendations:
/etc/systemd/system/prometheus.service.d/crunchy-prometheus-service-el7.conf/etc/systemd/system/alertmanager.service.d/crunchy-alertmanager-service-el7.conf
The below files contain startup properties for Prometheues and Alertmanager. Please review and modify these files as you see fit:
/etc/sysconfig/prometheus/etc/sysconfig/alertmanager
The below files dictate how Prometheus and Alertmanager will behave at runtime for the purposes of using pgmonitor. Please review each file below and follow the instructions in order to set things up:
| File | Instructions |
|---|---|
/etc/prometheus/crunchy-prometheus.yml |
Modify to set scrape interval if different from the default of 30s. Activate alert rules and Alertmanager by uncommenting lines when set as needed. Service file provided by pgmonitor expects config file to be named crunchy-prometheus.yml |
/etc/prometheus/crunchy-alertmanager.yml |
Setup alert target (e.g., SMTP, SMS, etc.), receiver and route information. Service file provided by pgmonitor expects config file to be named crunchy-alertmanager.yml |
/etc/prometheus/alert-ruled.d/crunchy-alert-rules-\*.yml.example |
Update rules as needed and remove .example suffix. Prometheus config provided by pgmonitor expects .yml files to be located in /etc/prometheus/alert-rules.d/ |
/etc/prometheus/auto.d/*.yml |
You will need at least one file with a final .yml extension. Copy the example files to create as many additional targets as needed. Ensure the configuration files you want to use do not end in .yml.example but only with .yml. Note that in order to use the provided Grafana dashboards, the extra “exp_type” label must be applied to the target and be set appropriately (pg or node). See the example target files provided for how to set the labels for postgres or node exporter targets. |
Enable Services
To enable and start Prometheus as a service, execute the following commands:
sudo systemctl enable prometheus
sudo systemctl start prometheus
sudo systemctl status prometheus
To enable and start Alertmanager as a service, execute the following commands:
sudo systemctl enable alertmanager
sudo systemctl start alertmanager
sudo systemctl status alertmanager
Setup Windows Server 2012R2
Currently the Windows installers assume you are logged in as the local Administrator account, so please ensure to do so before attempting the following.
Install the Prometheus, AlertManager, and Grafana servers by:
Find and launch the
pgMonitor_server_1.0_Crunchy.win.x86_64.exefile previously obtained from Crunchy Data. It will present you with the following screen. Choose your install path and click ‘Install’.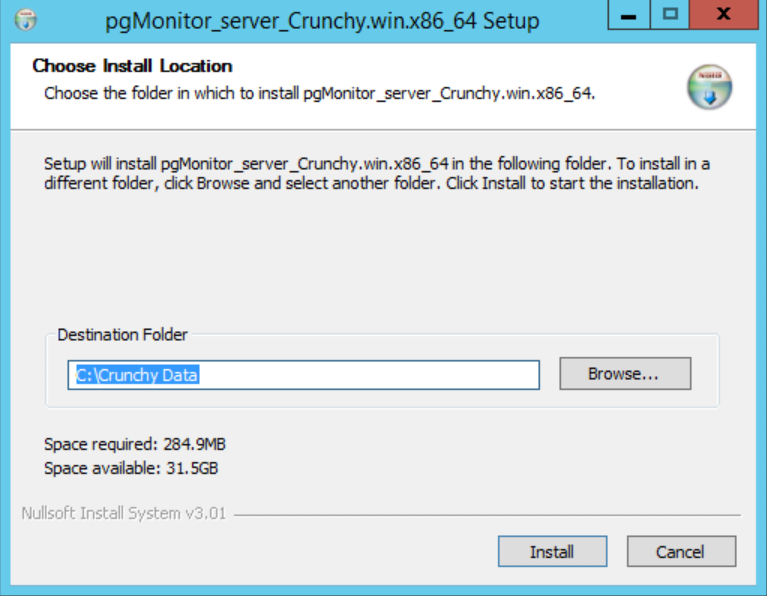
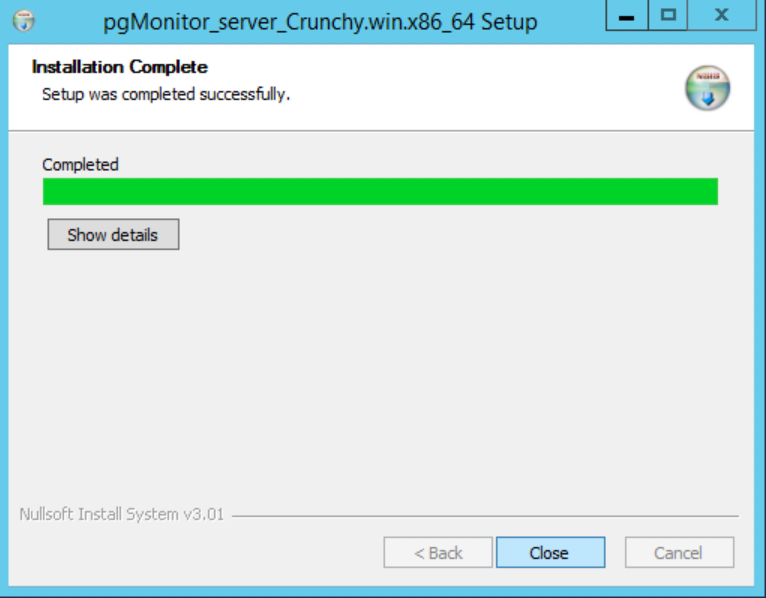
Once installation has finished, clicked ‘Close’:
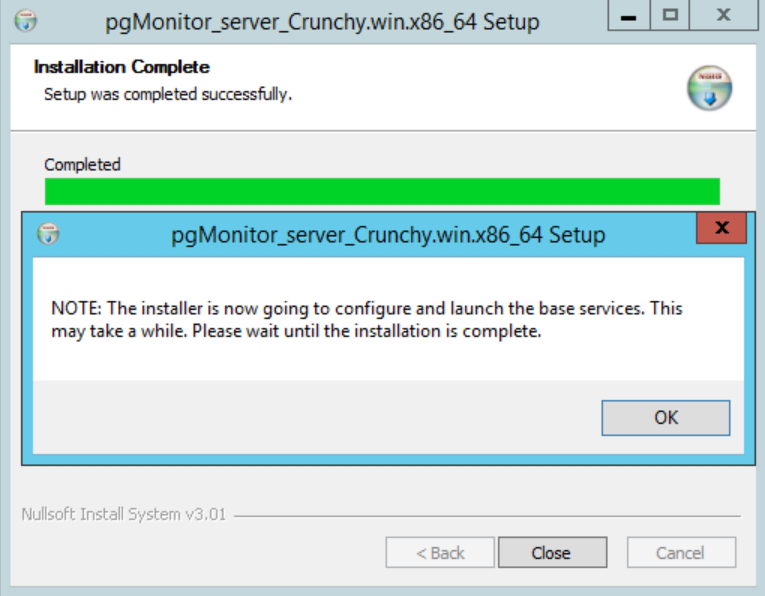
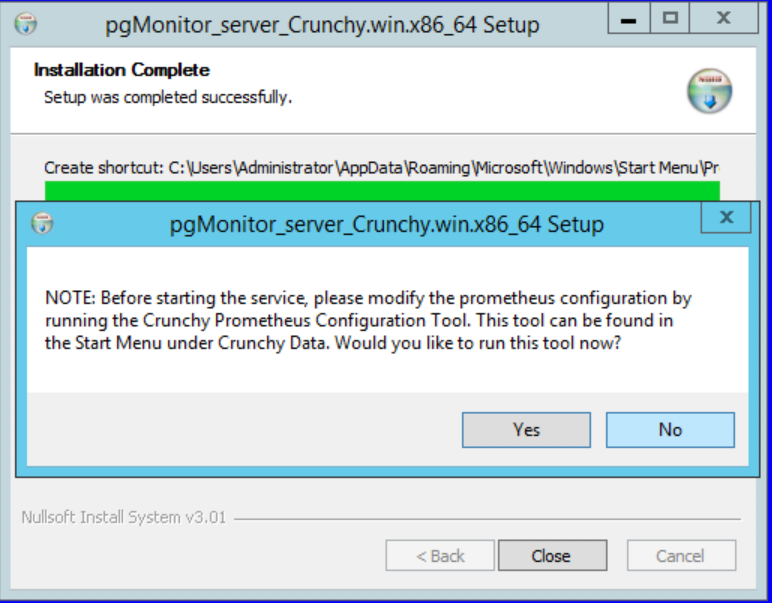
The installer will launch the Windows services that were just installed. Click ‘OK’ to proceed:
You will now be prompted to launch the configuration tool. Select ‘Yes’ to continue:
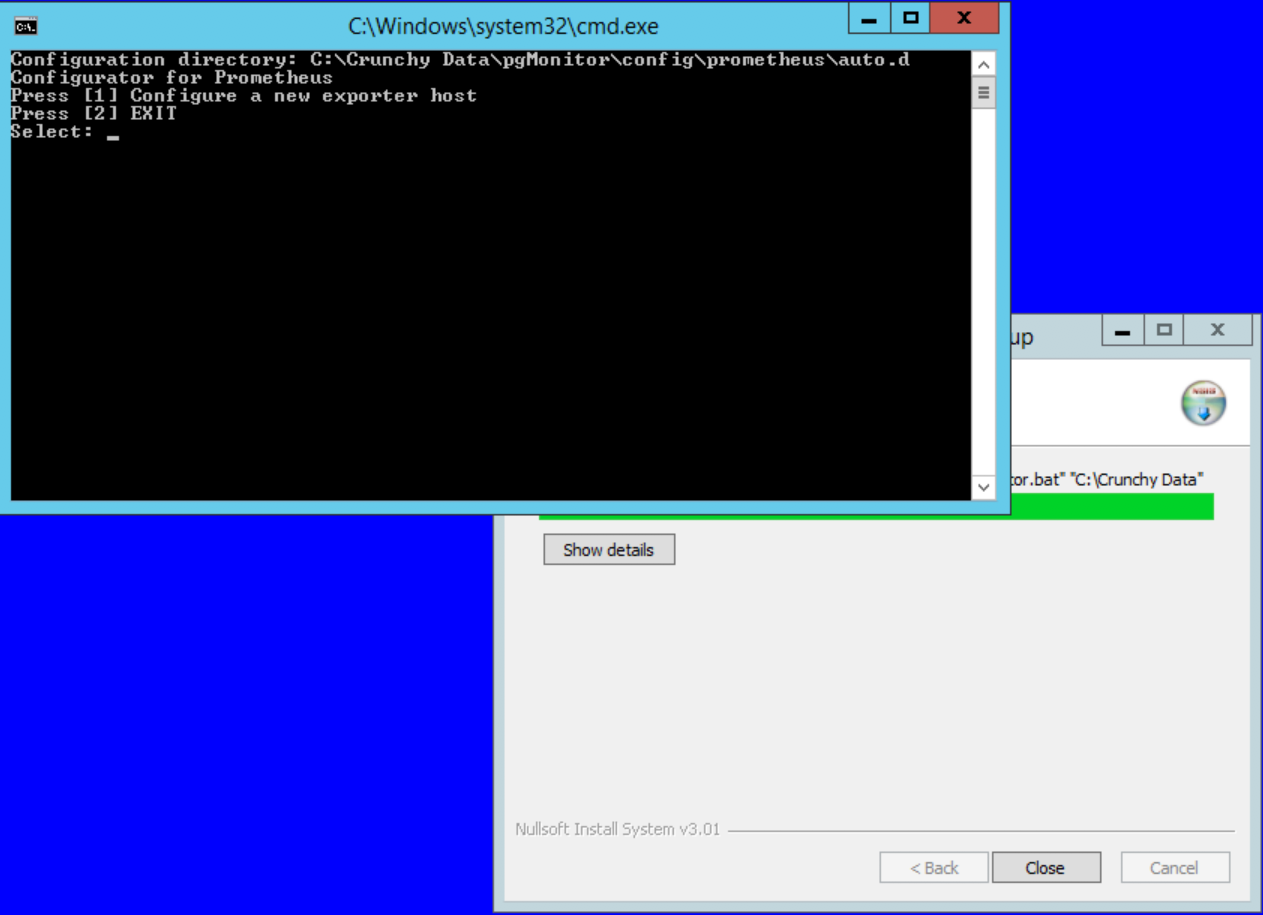
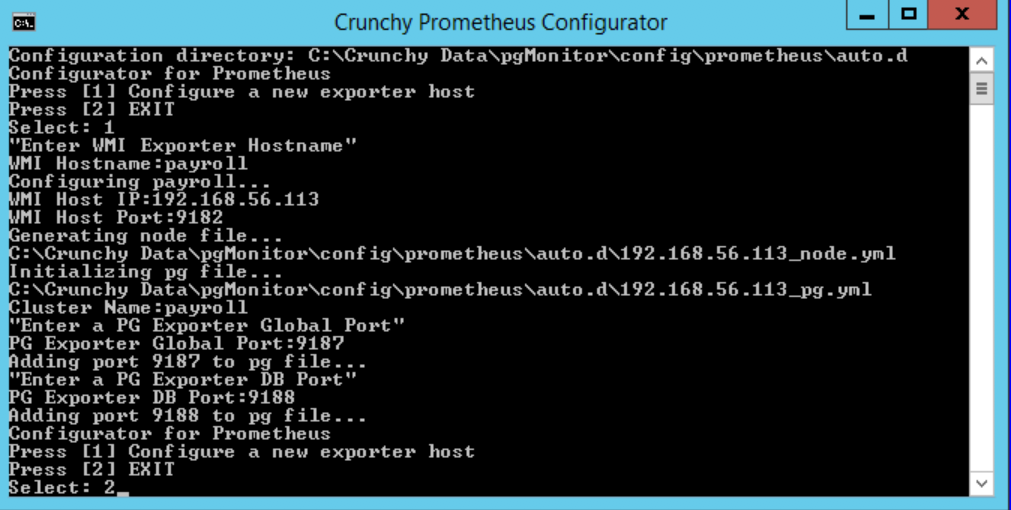
Select ‘1’ to tell Prometheus about the exporters it should scrape metrics from:
Enter the hostname (just the hostname, not the FQDN) of the PostgreSQL server that the exporters are running on. Next, enter the IP address of the PostgreSQL server, and the WMI port (default is 9182):
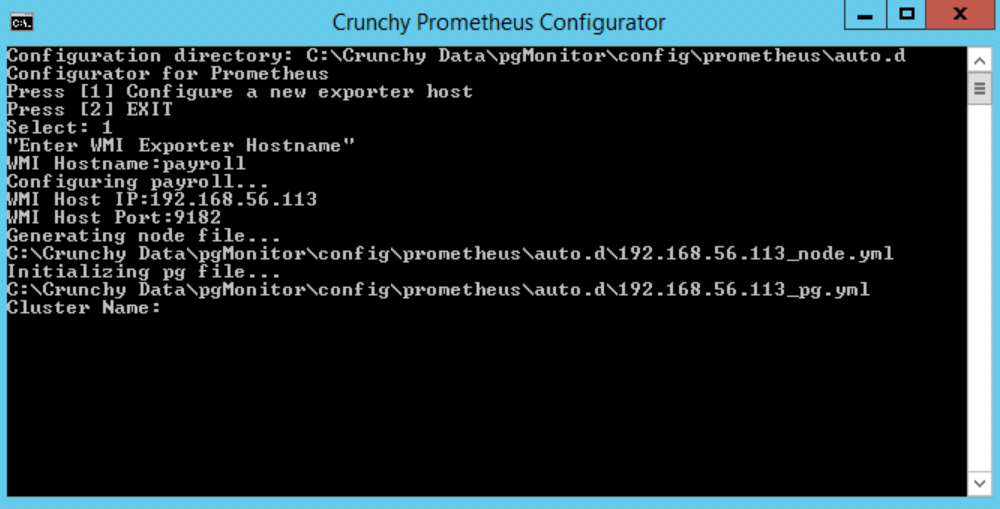
Enter a cluster name. This should be something simple but meaningful to identify the PostgreSQL cluster in question, e.g. payroll. Then enter the port used for both the cluster/global
postgres_exporter(9187 by default) and the per-dbpostgres_exporter(9188 in our directions):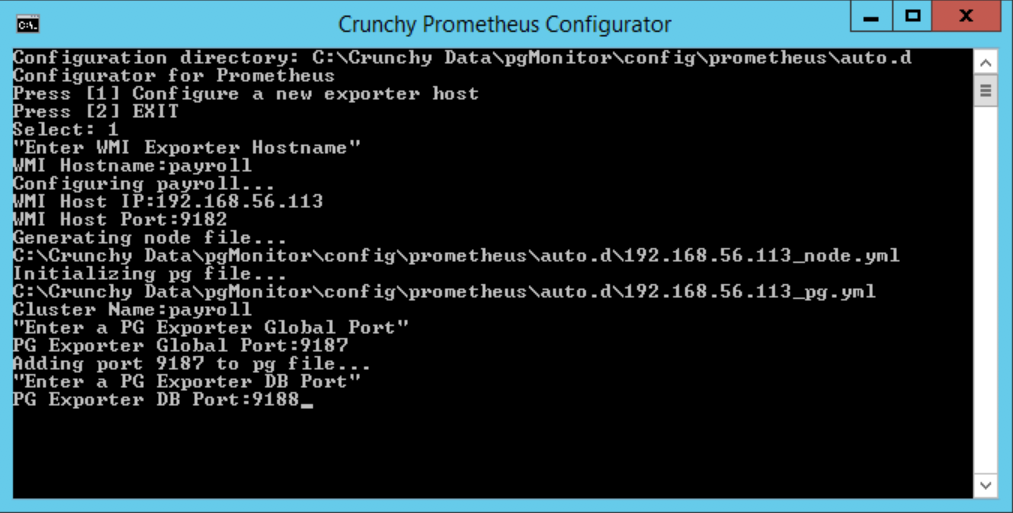
You can now choose ‘2’ to exit the configuration tool:
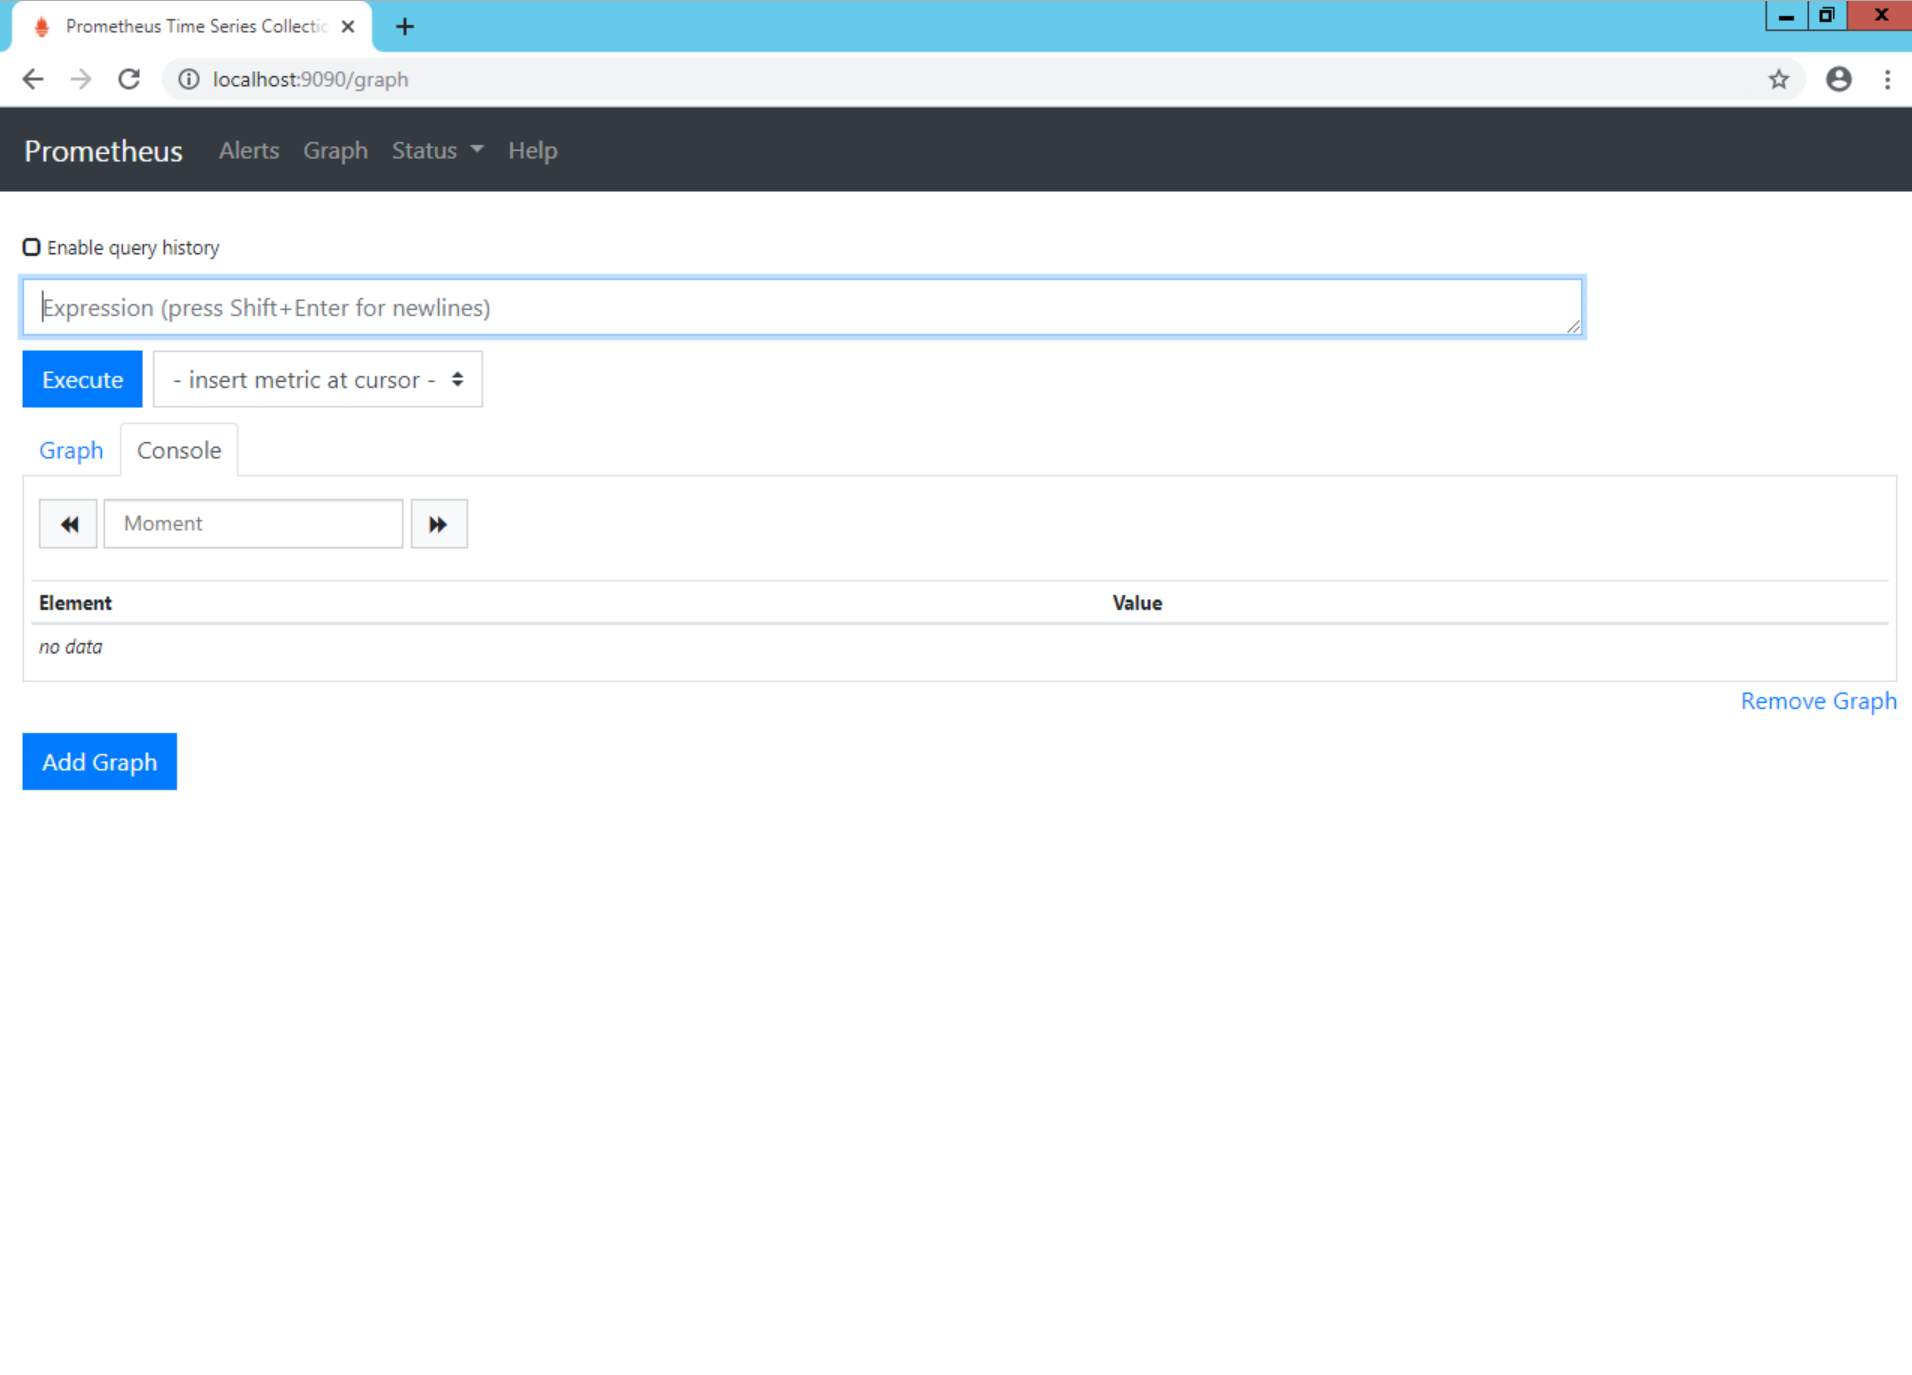
You can now verify that Prometheus is running by loading http://localhost:9090 in your browser:
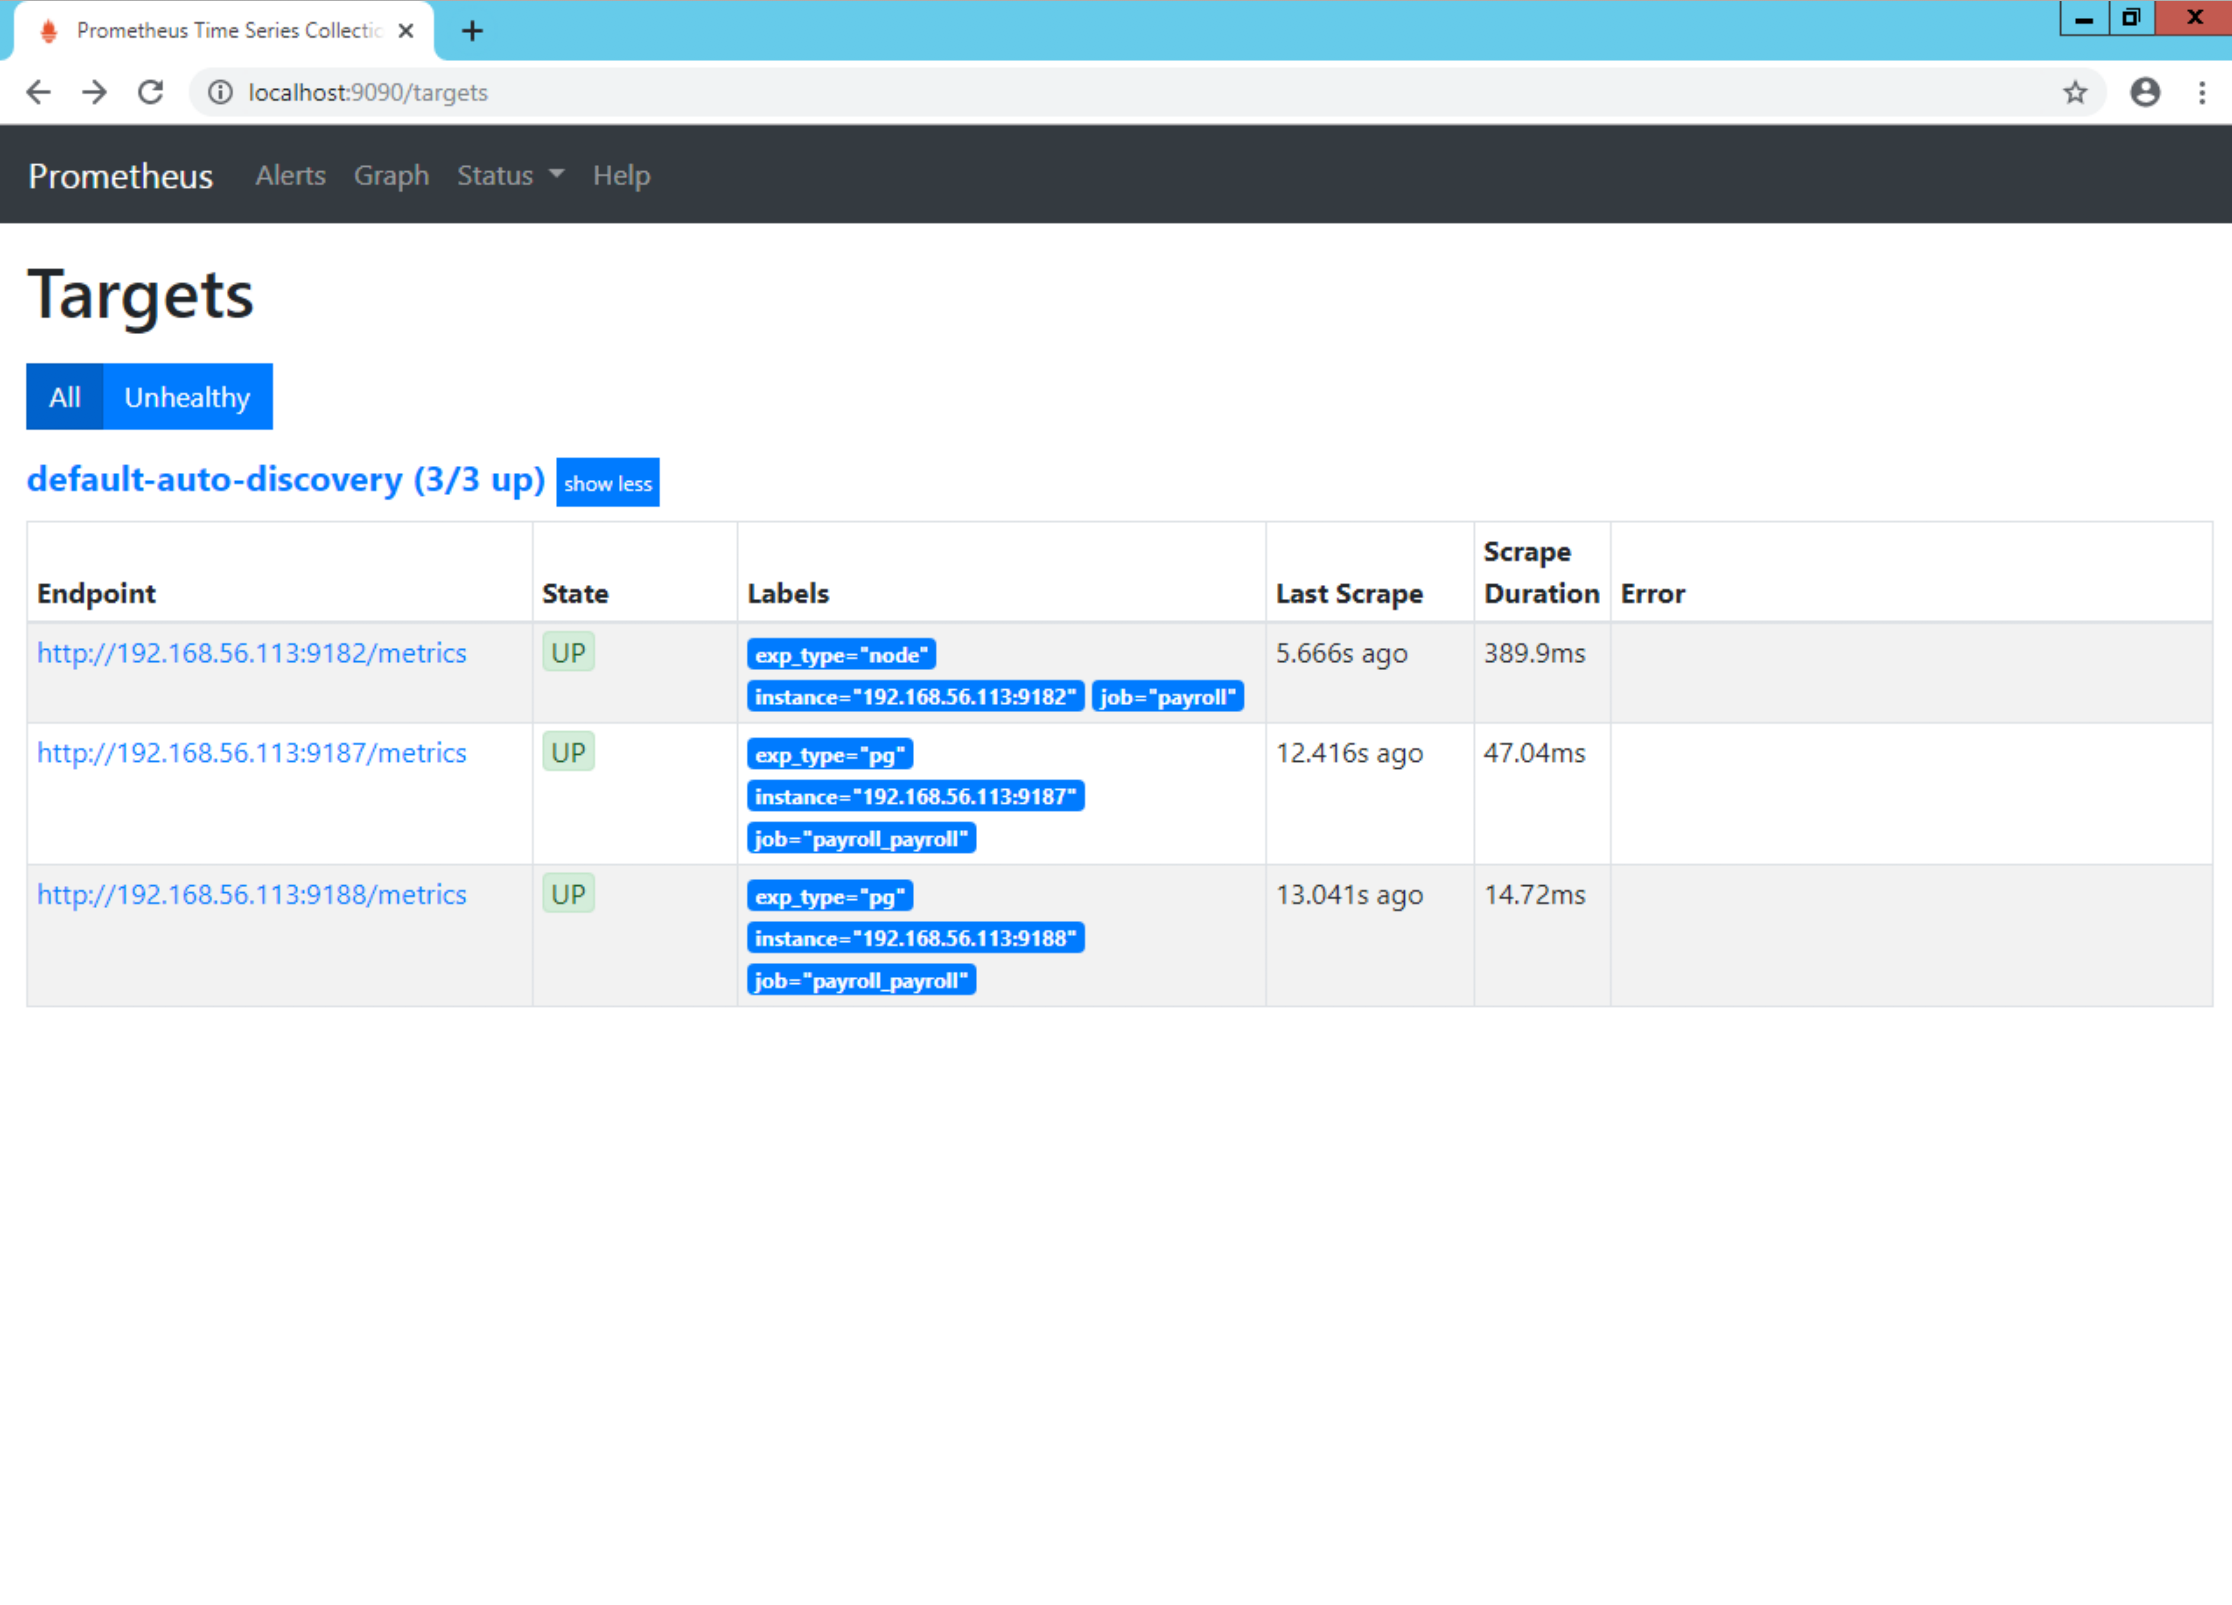
Finally, verify Prometheus can access the exporters by choosing ‘Status’ and then ‘Targets’:
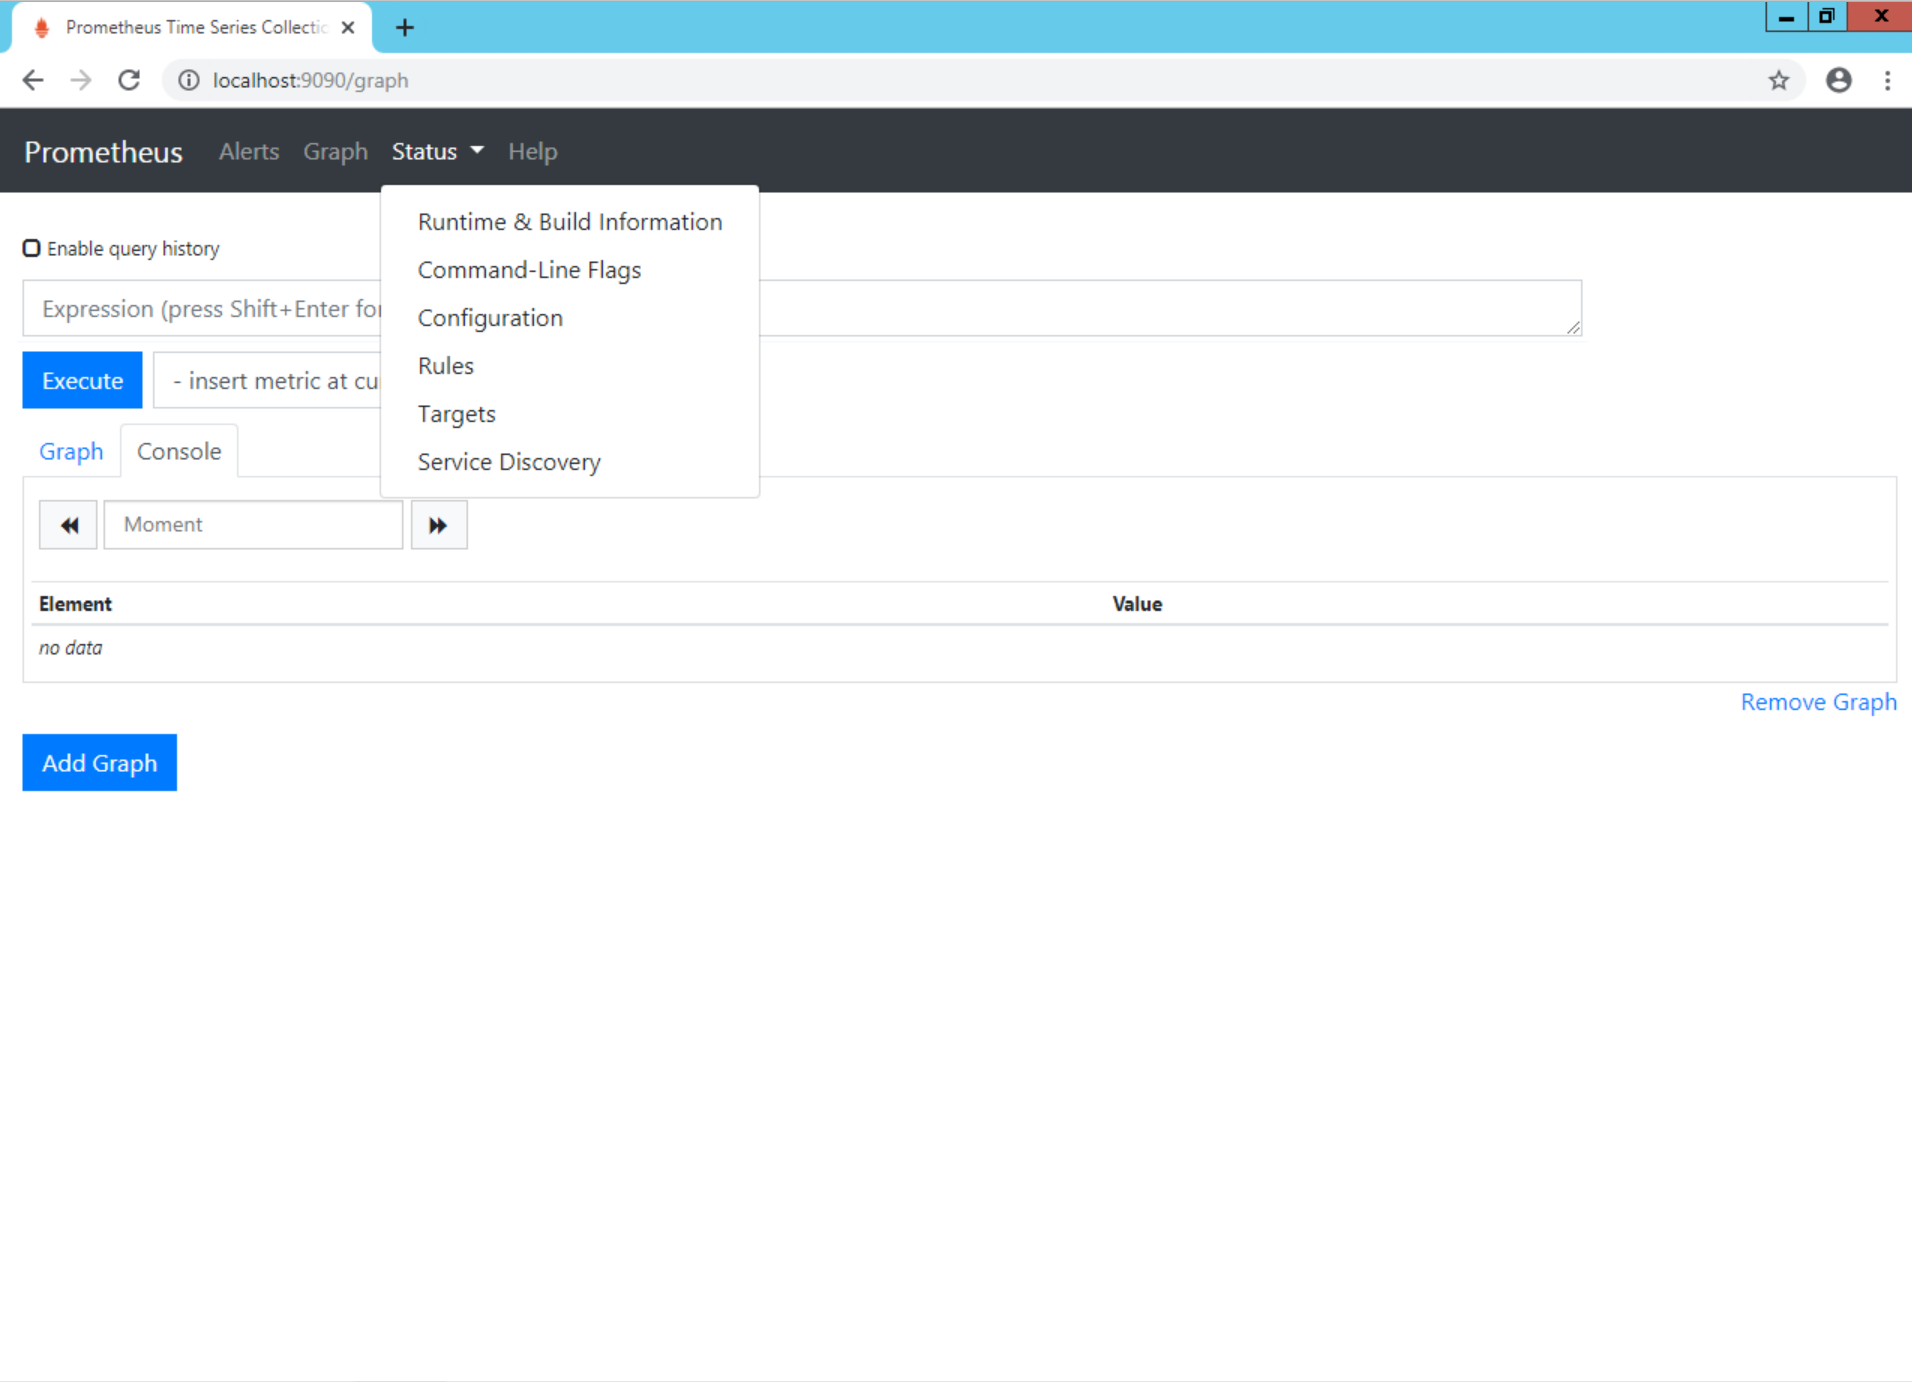
You should see all configured exporters (1 per PostgreWSQL server, and 2 more per PostgreSQL instance), all with a green ‘Up’ status: